
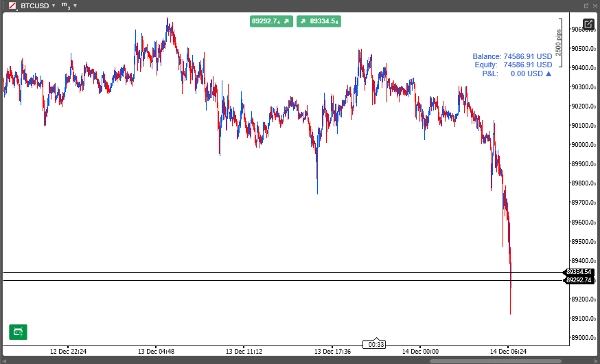
Equity and Balance
Wskaźnik
1 zakupy
Wersja 2.0, Dec 2025
Windows, Mac
4.5
Opinie: 2
Opis
Panel handlowy w czasie rzeczywistym dla cTrader
Krótka prezentacja:
Przekształć swoje wykresy cTrader w profesjonalne kokpit handlowy dzięki temu eleganckiemu nakładce z informacjami o koncie w czasie rzeczywistym. Idealne dla traderów, którzy chcą mieć natychmiastowy wgląd w stan konta bez przełączania okien.
Kluczowe funkcje:
- ✅ Wyświetlanie salda, kapitału i zysków/strat w czasie rzeczywistym – Zawsze widoczne w rogu wykresu
- ✅ Dostosowywalna pozycja i kolory – Wybierz spośród 9 pozycji wyrównania i niestandardowych schematów kolorów
- ✅ Optymalizacja wydajności – Konfigurowalne interwały aktualizacji zmniejszają zużycie CPU
- ✅ Metryki marginesu i ryzyka – Zawiera użyty margines, wolny margines i procentowe poziomy marginesu
- ✅ Profesjonalny design wizualny – Czysta typografia z wskaźnikami zysków/strat (▲/▼)
- ✅ Działa na wszystkich interwałach czasowych i instrumentach – Nieinwazyjna nakładka pozostająca w tle
Idealne dla:
- Traderów monitorujących wiele wykresów jednocześnie
- Traderów algorytmicznych potrzebujących szybkich kontroli stanu konta
- Początkujących uczących się śledzić wyniki konta
- Profesjonalistów chcących czystszej przestrzeni handlowej
Inne cBot wkrótce dostępne:
- Ultimate Trade Panel
- Order Control Panel
Podsumowanie
Podsumowanie AI
Equity and Balance is a real-time trading indicator designed for the cTrader platform that overlays key account metrics directly onto trading charts. It displays live balance, equity, profit and loss (P&L), margin used, free margin, and margin level percentages, providing continuous visibility without switching windows. The display is customizable with nine alignment positions and various color schemes to fit user preferences. It features a professional visual design with clear typography and profit/loss indicators (▲/▼). The indicator is optimized for performance with configurable update intervals to minimize CPU usage. It works seamlessly across all timeframes and instruments, maintaining a non-intrusive presence in the chart background. This tool is suitable for traders monitoring multiple charts, algorithmic traders requiring quick account status checks, beginners tracking account performance, and professionals seeking a cleaner workspace. Supported markets include Forex, indices, commodities, cryptocurrencies, and stocks.
Profil wskaźnika
Opinie klientów
4.5
Opinie: 2
5 | 50 % | |
4 | 50 % | |
3 | 0 % | |
2 | 0 % | |
1 | 0 % |
Opinie klientów
December 25, 2025
The signal still needs a chart check, no surprise there. Bad settings can ruin the idea.
December 24, 2025
The setup improves when the noisy parts of the chart show up earlier, and 30 days gives the idea room.
Dyskusja
Częste pytania
Prop
Forex
Indices
Commodities
Crypto
Stocks
Produkty dostępne za pośrednictwem cTrader Store, w tym boty handlowe, wskaźniki i wtyczki, dostarczane są przez deweloperów zewnętrznych i udostępniane wyłącznie w celach informacyjnych oraz w celu zapewnienia dostępu technicznego. cTrader Store nie jest brokerem i nie zapewnia doradztwa inwestycyjnego, nie udziela spersonalizowanych rekomendacji ani nie gwarantuje przyszłych wyników.
Więcej od tego autora


![Logo „[Hamster-Coder] Moving Average MTF”](https://cdn.ctrader.com/image/webp/b11b98b1-194d-4b8e-b00e-d611826ad159_31226)


Cena
Od 19/08/2025
4
Sprzedaż
315
Bezpłatne instalacje