
RSI Trend Trigger
指标
983 下载
版本 1.0, Apr 2025
Windows 版、Mac 版
4.6
评价:3
说明
🔥 Pinescritlabs
Ctrader Store 指标: 🤖Pinescritlabs Ctrader Store cBots:
RSI 趋势触发器 📈✨
它是如何工作的? 🤔
步骤 1:传统 RSI
计算标准的 相对强弱指数 (RSI),衡量一定时期内价格变动的速度和幅度。其在 0 到 100 之间波动,识别超买状态(例如,高于 70)和超卖状态(例如,低于 30)。📊📉📈
步骤 2:动态优化
传统 RSI 经过一个 高级平滑处理:
- 对原始 RSI 值(而非价格本身)进行第二次数学计算。
- 此步骤生成更稳定的 RSI 版本,减少轻微波动(市场噪音),突出真实趋势。
- 与基本平滑不同,此方法 保持对重要动量变化的响应性,避免过度延迟。🛡️🔄
为什么优化很重要? 🤩
- 智能过滤:消除由临时波动(如新闻冲击或投机性动作)引起的假信号。🗑️
- 更清晰的趋势:双重计算方法区分小幅调整和真正的趋势反转。🎯
- 持续信号:一旦确认趋势(多头/空头),指标将保持该状态直到出现明确反转,避免信号跳跃。🔒
实用应用:阈值与决策 📈
优化后的 RSI 结合了 两个可调阈值:
- 多头阈值(例如,60):
-
- 如果优化后的 RSI 超过此水平,确认为 多头趋势。🚀
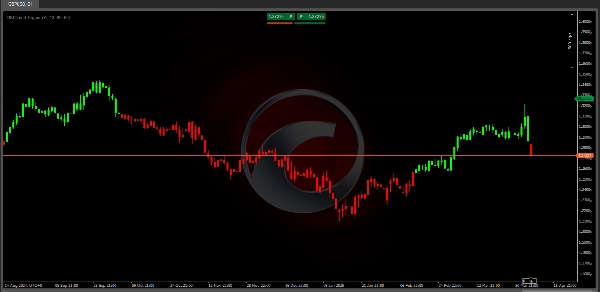
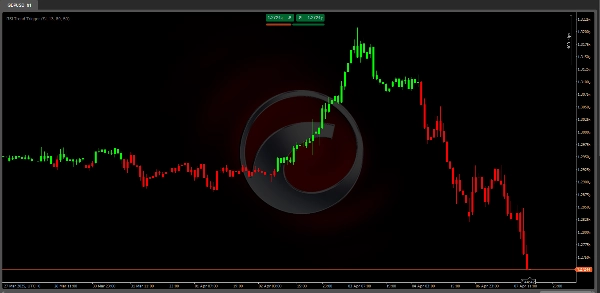
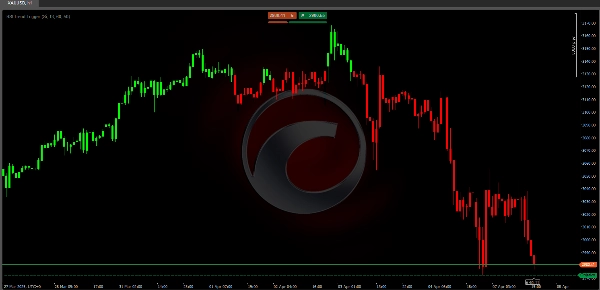
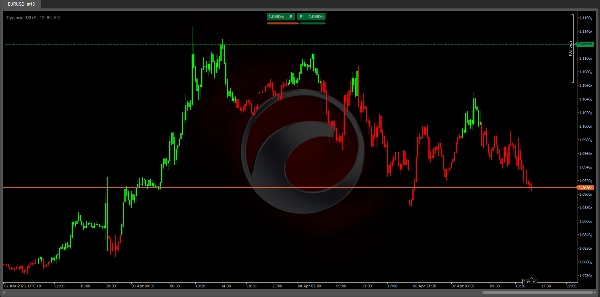
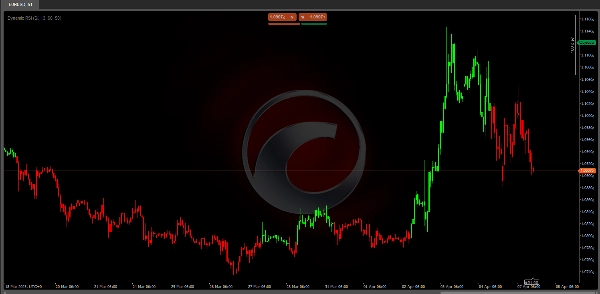
- 蜡烛变绿
- 空头阈值(例如,50):
-
- 如果优化后的 RSI 低于此水平,触发 空头趋势。📉
- 蜡烛变红
关键规则:
- 信号 仅在趋势变化时出现(非每次波动),减少信息过载。🚫📢
- 阈值可自定义:对波动市场使用较高值(例如,65/55),对平稳趋势使用较低值(例如,55/45)。⚙️
交易者的好处 🏆
- 提高精度:
-
- 通过双层过滤减少假信号。适合横盘市场或假突破。✅
- 直观可视化:
-
- 彩色蜡烛和视觉阈值让您瞬间识别趋势。👀🎨
- 适应性强:
-
- 适用于多种资产(外汇、股票、加密)和时间框架(分钟到周)。🌍⏳
- 趋势导向交易:
-
- 帮助顺势交易,避免风险较高的逆势操作。🎯🚦
示例信号流程
假设优化后的 RSI 处于 55 (中性区):
- 多头情景:上升至 62 → 超过 60 阈值 → 蜡烛变绿🚀
- 空头情景:下降至 48 → 低于 50 阈值 → 蜡烛变红📉
摘要
AI 摘要
RSI Trend Trigger is a technical indicator designed for use on the cTrader platform to identify and confirm market trends across various asset classes including forex, stocks, cryptocurrencies, commodities, and indices. It operates by first calculating the traditional Relative Strength Index (RSI), which measures the speed and magnitude of price movements to detect overbought or oversold conditions.
The indicator then applies an advanced smoothing process to the RSI values, not the price data, creating a refined RSI that reduces minor market noise while maintaining sensitivity to significant momentum changes. This dual-layer calculation enhances signal precision by filtering out false signals caused by temporary volatility and distinguishing between minor corrections and genuine trend reversals.
Users can customize two threshold levels—a bullish threshold (e.g., 60) and a bearish threshold (e.g., 50)—to define when a trend is confirmed. When the refined RSI crosses above the bullish threshold, the indicator signals a bullish trend with green candles; when it falls below the bearish threshold, it signals a bearish trend with red candles. Signals appear only during trend changes, reducing information overload.
The RSI Trend Trigger supports multiple timeframes from minutes to weeks and is adaptable to different market conditions, aiding traders in aligning with momentum and avoiding counter-trend risks.
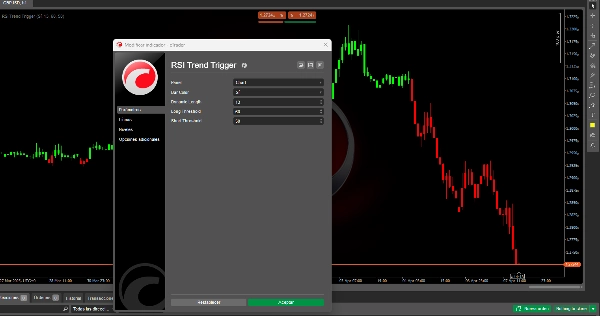
指标配置
客户评价
4.6
评价:3
5 | 67 % | |
4 | 33 % | |
3 | 0 % | |
2 | 0 % | |
1 | 0 % |
客户评价
October 4, 2025
I like it, but , take care about, place, conoslidation, down and up trend. NIce
August 12, 2025
Pros: Reliable trend filter based on RSI crossing customizable levels (e.g. 50). Lightweight and fast. Ideal for trend-following setups. Cons: No tooltips, alerts, or preset management. Needs confirmation via volume or price action to avoid false triggers.
讨论
常见问答
BTCUSD
Forex
Signal
Breakout
Indices
Supertrend
Commodities
RSI
Crypto
Stocks
XAUUSD
cTrader Store 提供的所有产品,包括交易机器人、指标和插件,均由第三方开发者提供,仅供信息参考和技术访问之用。cTrader Store 并非经纪商,不提供投资建议、个人推荐或任何未来业绩保证。


!["[Hamster-Coder] Pivot Points MTF" 标识](https://cdn.ctrader.com/image/webp/4c143e5a-309c-40e3-a578-f04d1e133ffa_31159)


价格
注册日期 03/10/2024
163
销售
37.71K
免费安装