
Pivot Points Clasic,FIBO,etc
Indicateur
819 téléchargements
Version 1.0, Jul 2025
Windows, Mac
Description
Points Pivot Personnalisables — L'indicateur Pivot Tout-en-Un Ultime pour cTrader
Libérez la puissance de l'analyse professionnelle de l'action des prix avec un outil polyvalent !
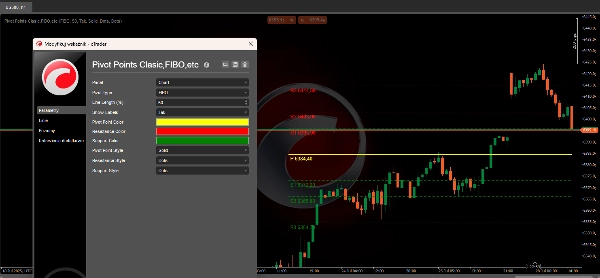
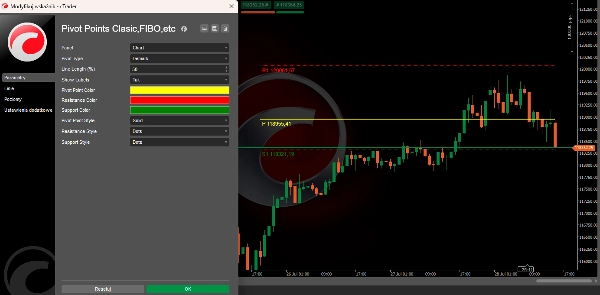
Points Pivot Personnalisables est un indicateur avancé et très flexible pour cTrader qui met toutes les principales méthodes de calcul des pivots à portée de main — vous offrant des niveaux clairs de support/résistance, un style personnalisé et un étiquetage intelligent du graphique.
Caractéristiques principales :
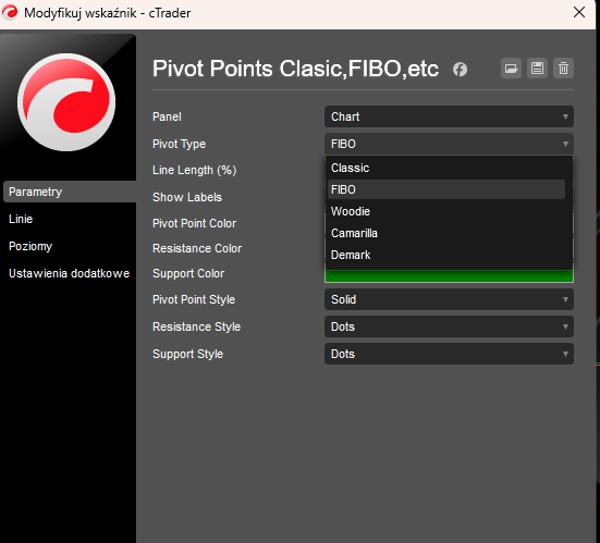
- 5 Méthodes de Pivot en Une :
Passez instantanément entre les formules Classique, Fibonacci, Woodie, Camarilla et Demark. Parfait pour tous les styles de trading : scalping, day trading et swing trading. - Personnalisation Complète :
-
- Choisissez votre méthode de calcul des pivots.
- Définissez des couleurs et styles de ligne personnalisés pour les niveaux de pivot, résistance et support.
- Ajustez la longueur visible des lignes en pourcentage de votre graphique pour des visuels propres et sans encombrement.
- Activez/désactivez les étiquettes intelligentes qui affichent les niveaux de prix en temps réel pour chaque pivot.
- Superposition Professionnelle sur le Graphique :
Trace les pivots et niveaux S/R directement sur votre graphique des prix, se mettant à jour automatiquement à l'apparition de nouvelles barres.
Niveaux supportés pour chaque méthode : -
- Classique, Fibo, Woodie : Jusqu'à 3–4 résistances (R1–R4) et supports (S1–S4)
- Camarilla : Jusqu'à 4 résistances et supports
- Demark : Niveaux uniques personnalisés (R1, S1, et Pivot uniquement)
- Ultra Rapide & Léger :
Optimisé pour la performance en temps réel — pas de latence, pas de bibliothèques externes, code 100 % natif cTrader. - Idéal pour Tous les Marchés :
Fonctionne parfaitement avec le Forex, les indices, les matières premières, les cryptos, et plus encore !
Pourquoi choisir Points Pivot Personnalisables ?
- Plusieurs stratégies, un seul outil : Changez de pivots en un clic — testez celui qui convient à votre marché !
- Repérez les niveaux clés en un coup d'œil :
Accès immédiat aux zones où les retournements ou cassures de prix sont les plus probables. - Clarté ultime du graphique :
Les lignes s'ajustent automatiquement à la fenêtre de votre graphique — fini les indicateurs encombrés ou qui se chevauchent. - Renforcez votre confiance en trading :
Sachez où les institutions et les pros surveillent le prix à chaque session.
Prenez de meilleures décisions de trading dès aujourd'hui. Essayez Points Pivot Personnalisables — et constatez la différence dans votre analyse technique !
Résumé
Résumé IA
Pivot Points Customizable is a versatile indicator designed for the cTrader platform that integrates five major pivot point calculation methods: Classic, Fibonacci, Woodie, Camarilla, and Demark. It provides traders with clear support and resistance levels directly overlaid on price charts, updating automatically as new bars form. Users can fully customize the indicator by selecting pivot calculation methods, adjusting colors and line styles for pivot, resistance, and support levels, and setting line lengths relative to the chart window to maintain visual clarity. Smart labels displaying real-time price levels for each pivot can be toggled on or off. The indicator supports multiple resistance and support levels depending on the method chosen—up to four for Classic, Fibonacci, Woodie, and Camarilla, and unique levels for Demark. Optimized for real-time performance with native cTrader code, it operates without lag or external dependencies. This tool is suitable for various trading styles including scalping, day trading, and swing trading, and is compatible with multiple markets such as Forex, indices, commodities, and cryptocurrencies. It aims to assist traders in identifying key price levels where reversals or breakouts are likely, enhancing technical analysis and decision-making.
Profil de l'indicateur
Avis clients
0.0
Avis : 0
Avis clients
Il n'y a pas encore d'avis sur ce produit. Vous l'avez déjà essayé ? Soyez le premier à en parler aux autres !
Discussion
Questions fréquentes
Les produits disponibles sur cTrader Store, notamment les bots de trading, les indicateurs et les plug-ins, sont fournis par des développeurs tiers et mis à disposition à titre informatif et à des fins d'accès technique uniquement. cTrader Store n'est pas un courtier et ne fournit aucun conseil en investissement, aucune recommandation personnelle ni aucune garantie quant aux performances futures.


Prix
Depuis le 26/06/2025
59.07M
Volume tradé
965.98K
Pips gagnés
819
Installations gratuites