
Larry Williams 9.1
Индикатор
168 скачивания
Версия 1.0, Apr 2025
Windows, Mac
Описание
Ларри Уильямс 9.1
Сводка
ИИ-сводка
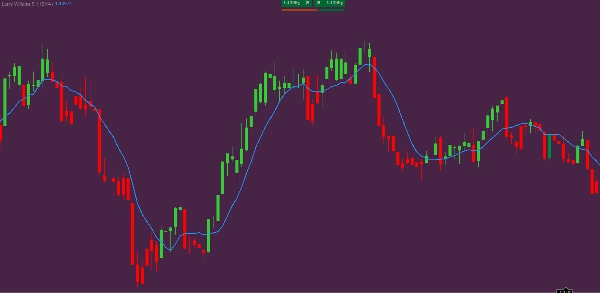
Larry Williams 9.1 is a trading indicator designed to assist traders in market analysis. The product provides a technical tool named after Larry Williams, intended for use within trading platforms. It does not specify particular markets, timeframes, or trading styles, nor does it include detailed functionality or supported features in the description. The indicator is available as a standalone product and is represented visually by associated image assets.
Профиль индикатора
Отзывы покупателей
0.0
Отзывы: 0
Отзывы покупателей
У этого продукта еще нет отзывов. Уже попробовали его? Поделитесь впечатлениями!
Обсуждение
Частые вопросы
Продукты, доступные в cTrader Store, включая торговых ботов, индикаторы и плагины, предоставляются сторонними разработчиками и доступны исключительно в информационных и технических целях. cTrader Store не является брокером и не предоставляет инвестиционные консультации, персональные рекомендации или какие-либо гарантии будущей доходности.
Больше от этого автора


![Логотип продукта "Tabajara corrigido[fix]"](https://cdn.ctrader.com/image/webp/7f4bbef8-b245-4ebd-80d7-582fffc0c90c_28378)


Цена
С 10/02/2025
1.27K
Бесплатные установки