
Описание
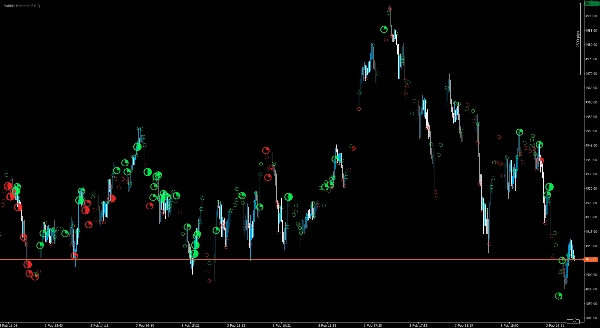
Delta Peak Bubbles создан для трейдеров, которые хотят быстрый и наглядный способ определить «где рынок выполняет работу» на тиковых графиках. Вместо того чтобы загромождать экран дополнительными панелями, он рисует четкие, градуированные пузырьки прямо на графике, чтобы в реальном времени показать всплески высокой активности.
Индикатор фокусируется на пиковых моментах внутри каждого бара и визуализирует их с помощью легко читаемой шкалы силы (от едва заметных кругов до выделяющейся звезды для самых сильных событий). Пузырьки окрашены по цвету для быстрого определения направления, что позволяет легко отличить бычье от медвежьего давления с первого взгляда.
Разработанный для практических торговых процессов, Delta Peak Bubbles особенно хорошо подходит для:
- Скальпинга и краткосрочной торговли по моментуму
- Подтверждения пробоев и отслеживания импульсов
- Определения зон реакции и потенциальных точек истощения
- Добавления «теплового слоя» к стратегиям Price Action / SMC / ключевых уровней
Руководство по силе пузырьков
Пузырьки разделены на четыре уровня силы, чтобы помочь быстро отделить обычную активность от высокоэффективных всплесков:
- Уровень 1 – Низкий:
○(незначительный всплеск) - Уровень 2 – Средний:
◔(умеренный всплеск) - Уровень 3 – Высокий:
◑(сильный всплеск) - Уровень 4 – Экстремальный:
★(очень сильный / выделяющийся всплеск)
Цвет указывает направление давления (зеленый = бычье, красный = медвежье).
Элементы управления отображением делают интерфейс чистым на любом макете, включая 4K-мониторы, так что вы можете сохранять читаемость графика, одновременно видя важные моменты.
Отказ от ответственности: Торговля/инвестирование связаны с существенными рисками и могут привести к потере всего вложенного капитала. Этот индикатор предоставляется только в информационных и аналитических целях и не является финансовой консультацией, предложением или рекомендацией. Использование осуществляется на ваш собственный риск; вы остаетесь единственным ответственным за все торговые решения и результаты. Провайдер не дает никаких заявлений или гарантий (явных или подразумеваемых) относительно точности, полноты, своевременности, производительности, товарной пригодности или пригодности для конкретной цели. В максимально допустимой законом степени провайдер не несет ответственности за любые прямые или косвенные убытки, повреждения или упущенную выгоду, возникающие из использования этого индикатора (включая, без ограничений, убытки из-за рыночных условий, проблем с данными/платформой, ошибок конфигурации или неправильного использования). Прошлые результаты не являются надежным индикатором будущих.
Сводка
Отзывы покупателей
5 | 33 % | |
4 | 67 % | |
3 | 0 % | |
2 | 0 % | |
1 | 0 % |


