
Mô tả
Chỉ Báo Săn Cá Voi – Học Viện Bukhari
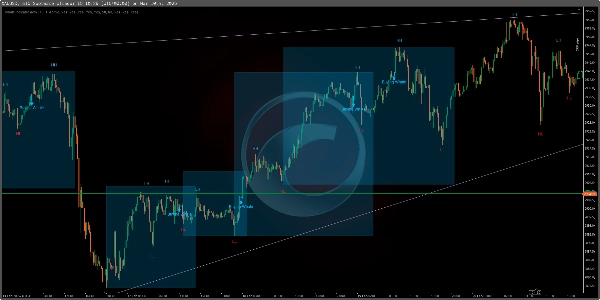
Chỉ Báo Săn Cá Voi là một công cụ giao dịch mạnh mẽ được thiết kế đặc biệt cho chỉ số Boom & Crash và chỉ số Biến Động. Nó có tính năng Phát Hiện Xu Hướng Tự Động, phát hiện xu hướng tăng và giảm, đánh dấu các điểm cấu trúc thị trường (HH, HL, LH, LL), và cung cấp tín hiệu mua và bán chính xác cao giúp nhà giao dịch đưa ra quyết định sáng suốt.
Tính Năng Chính:
✅ Phát Hiện Xu Hướng Tự Động – Tự động xác định xu hướng thị trường, giảm thiểu nhu cầu phân tích thủ công.
✅ Thiết Kế Cho Chỉ Số Boom & Crash và Biến Động – Tối ưu hóa cho giao dịch các thị trường tổng hợp này.
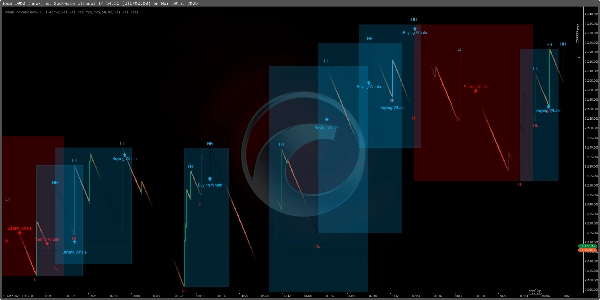
✅ Phát Hiện Đỉnh Giá Trên Boom & Crash (Khung Thời Gian M1) – Nhận diện các đỉnh giá trên M1, giúp nhà giao dịch bắt kịp các biến động giá nhanh chóng.
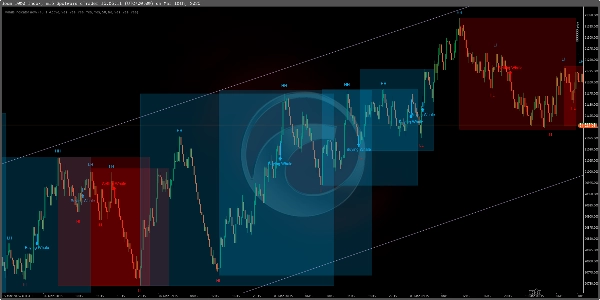
✅ Xác Định Xu Hướng Trên M15 – Hoạt động hiệu quả trên M15 cho phân tích xu hướng bình thường và thiết lập giao dịch có cấu trúc.
✅ Phân Tích Cấu Trúc Thị Trường – Hiển thị Đỉnh Cao Hơn (HH), Đáy Cao Hơn (HL), Đỉnh Thấp Hơn (LH), và Đáy Thấp Hơn (LL) để hiểu rõ hơn về xu hướng.
✅ Tín Hiệu Vào Lệnh Cá Voi – Làm nổi bật các điểm "Cá Voi Mua" và "Cá Voi Bán" cho các điểm vào lệnh chính xác.
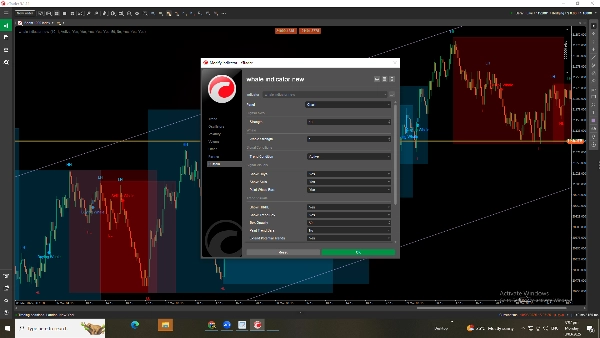
✅ Cài Đặt Tùy Chỉnh Hoàn Toàn – Điều chỉnh độ mạnh cá voi, độ nhạy tín hiệu và điều kiện xu hướng để tinh chỉnh phương pháp giao dịch của bạn.
✅ Bật/Tắt Các Tính Năng – Chuyển đổi hộp xu hướng, điểm cấu trúc và tín hiệu mua/bán khi cần thiết.
Cách Sử Dụng Chỉ Báo Săn Cá Voi?
1️⃣ Phát Hiện Xu Hướng Tự Động – Để chỉ báo tự động xác định hướng xu hướng.
2️⃣ Giao Dịch Đỉnh Giá Boom & Crash Trên M1 – Tìm tín hiệu trên M1 để bắt các đỉnh giá một cách hiệu quả.
3️⃣ Phân Tích Xu Hướng Thị Trường Trên M15 – Sử dụng M15 cho phân tích xu hướng có cấu trúc và xác nhận giao dịch.
4️⃣ Theo Dõi Cấu Trúc Thị Trường – Dùng HH, HL, LH, LL để hiểu hướng và sức mạnh xu hướng.
5️⃣ Tìm Tín Hiệu Cá Voi – Vào lệnh tại các điểm "Cá Voi Mua" hoặc "Cá Voi Bán".
6️⃣ Tùy Chỉnh Để Đạt Độ Chính Xác – Điều chỉnh độ mạnh cá voi và độ nhạy tín hiệu để tối ưu kết quả.
7️⃣ Bật/Tắt Các Tính Năng – Thay đổi điều kiện xu hướng và cài đặt cấu trúc theo chiến lược của bạn.
Chỉ báo này là hoàn hảo cho chỉ số Boom & Crash và Biến Động, cung cấp cơ hội giao dịch có xác suất cao với độ chính xác và hiệu quả. 🚀
Tóm tắt
Key functionalities include spike detection on the M1 timeframe for Boom & Crash indices to capture rapid price movements, and trend identification on the M15 timeframe for structured trade setups. Users can customize settings such as whale strength, signal sensitivity, and trend conditions to refine their trading approach. Features like trend boxes, structure points, and buy/sell signals can be enabled or disabled according to user preference.
The indicator supports efficient analysis and trade execution in synthetic markets, offering tools for both short-term spike trading and longer-term trend analysis. It is suitable for traders focusing on Boom & Crash and Volatility indices who seek precise market insights and customizable signal options.
Đánh giá của khách hàng
5 | 33 % | |
4 | 67 % | |
3 | 0 % | |
2 | 0 % | |
1 | 0 % |


