
sma color
Индикатор
192 скачивания
Версия 1.0, Apr 2025
Windows, Mac

Описание
цвет sma
Сводка
ИИ-сводка
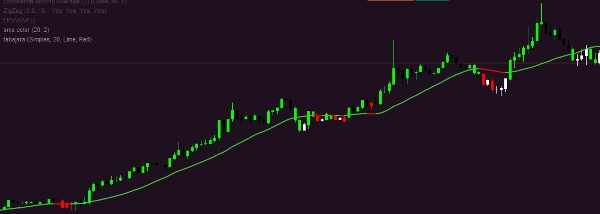
The "sma color" indicator is a technical analysis tool designed to display a simple moving average (SMA) with color differentiation. It visually represents the SMA line on trading charts, potentially using color changes to indicate different market conditions or trends. This indicator aids traders in identifying trend direction and momentum by smoothing price data over a specified period. It is compatible with various trading instruments and timeframes, providing a clear and straightforward way to analyze price movements.
Профиль индикатора
Отзывы покупателей
0.0
Отзывы: 0
Отзывы покупателей
У этого продукта еще нет отзывов. Уже попробовали его? Поделитесь впечатлениями!
Обсуждение
Частые вопросы
Продукты, доступные в cTrader Store, включая торговых ботов, индикаторы и плагины, предоставляются сторонними разработчиками и доступны исключительно в информационных и технических целях. cTrader Store не является брокером и не предоставляет инвестиционные консультации, персональные рекомендации или какие-либо гарантии будущей доходности.
Больше от этого автора


![Логотип продукта "Tabajara corrigido[fix]"](https://cdn.ctrader.com/image/webp/7f4bbef8-b245-4ebd-80d7-582fffc0c90c_28378)


Цена
С 10/02/2025
1.26K
Бесплатные установки