
Описание
📈 Сигнальное скользящее среднее 📉
Сигнальное скользящее среднее — это индикатор, который сочетает в себе простое скользящее среднее (SMA) с динамическим расчетом корреляции для лучшей адаптации к рыночным условиям. 🎯 Этот индикатор регулирует свою чувствительность в зависимости от силы тренда, что делает его мощным инструментом для выявления трендов и фильтрации рыночного шума. 🌟
Основные характеристики 🔑
📊 Скорректированное скользящее среднее:
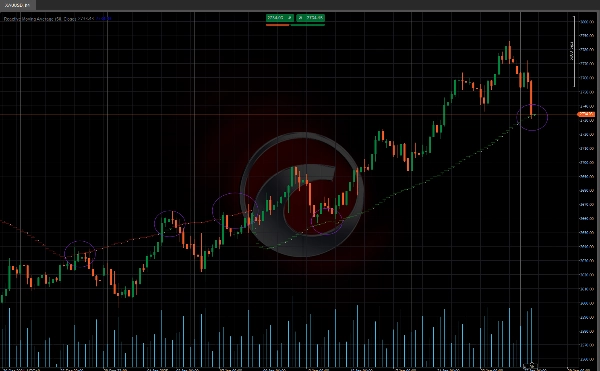
- Линия скользящего среднего динамически регулируется на основе корреляции между ценой и временем.
- На рынках с сильным трендом скользящее среднее движется быстрее, чтобы следовать за ценой. 🚀
- На боковых рынках скользящее среднее остается более стабильным, уменьшая количество ложных сигналов. 🛑
🔢 Расчет корреляции:
- Индикатор вычисляет корреляцию между ценой и временем с использованием формулы Пирсона.
- Он корректирует скользящее среднее на основе коэффициента детерминации (R²). 🧮
👀 Визуализация:
- Четкое и интуитивно понятное отображение для легкой интерпретации. 📉📈
Как использовать индикатор 🛠️
🔍 Определение тренда:
- Бычий тренд: когда цена находится выше скоррелированного скользящего среднего. 🐂
- Медвежий тренд: когда цена находится ниже скоррелированного скользящего среднего. 🐻
✅ Подтверждение сигнала:
- Используйте скорректированное скользящее среднее как динамический уровень поддержки или сопротивления. 🛡️
- Комбинируйте этот индикатор с другими техническими инструментами для подтверждения сигналов. 🔄
Настройка скользящего среднего ⚙️
Алгоритм настраивает скользящее среднее на основе значения R²:
- Если R² > 0.5 (значимая корреляция):
-
- Скользящее среднее корректируется с использованием взвешенного сочетания между текущим значением SMA и предыдущим значением скорректированного скользящего среднего (_ma).
- Вес зависит от значения R². ⚖️
- Если R² ≤ 0.5 (незначимая корреляция):
-
- Скользящее среднее корректируется путем вычитания значения, пропорционального абсолютной разнице между текущим значением SMA и предыдущим значением скорректированного скользящего среднего. 🔄
- Индикаторы Ctrader Store:
Сессии разрыва справедливой стоимости
Динамическая рыночная структура
Анализ поворотных точек
Линейная регрессия Фибоначчи
Мультивременная регрессия
Импульсный разрыв справедливой стоимости
Многоуровневый свечной уклон
Трекер
Автоматический трендовый канал
Авто линии поддержки и
сопротивления тренда
Все уровни поддержки и
сопротивления
Сводка
Key functionalities include:
- **Adjusted Moving Average**: The moving average line dynamically adapts according to the correlation between price and time. It accelerates in strong trending markets to closely follow price movements and stabilizes in sideways markets to minimize false signals.
- **Correlation Calculation**: Utilizes the Pearson formula to compute the correlation between price and time, adjusting the moving average based on the coefficient of determination (R²).
- **Moving Average Adjustment**: When R² is greater than 0.5, the moving average is updated using a weighted combination of the current SMA and the previous adjusted value, with weights depending on R². For R² less than or equal to 0.5, adjustments are made by subtracting a value proportional to the difference between the current SMA and prior adjusted average.
- **Visualization**: Provides a clear and intuitive display for easy interpretation.
Usage involves identifying bullish trends when price is above the adjusted moving average and bearish trends when below. The indicator can also serve as a dynamic support or resistance level and be combined with other technical tools for signal confirmation.
Отзывы покупателей
5 | 100 % | |
4 | 0 % | |
3 | 0 % | |
2 | 0 % | |
1 | 0 % |


