Description
IR Open Connector
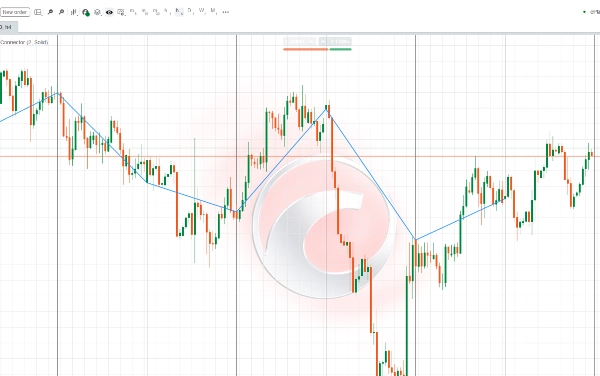
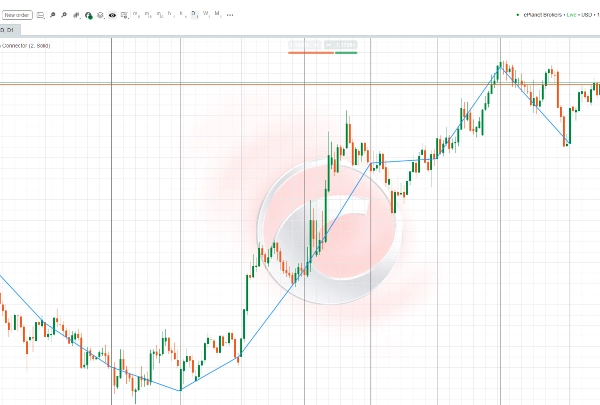
Cet indicateur est conçu pour connecter les prix d'ouverture des chandeliers de périodes supérieures, en fonction de la période actuelle du graphique :
- Si la période est inférieure à une heure → connecte les ouvertures des chandeliers journaliers.
- Si la période est de 4 heures → connecte les ouvertures des chandeliers hebdomadaires.
- Si la période est supérieure à 4 heures mais inférieure à hebdomadaire → connecte les ouvertures des chandeliers mensuels.
Cela permet aux traders de visualiser clairement les niveaux clés d'ouverture des périodes supérieures (journalière, hebdomadaire, mensuelle) directement sur leurs graphiques. Ces niveaux servent souvent de zones critiques de support et de résistance, de zones potentielles d'initiation de tendance, et de points de référence importants dans l'analyse du marché.
La couleur, l'épaisseur et le style de la ligne sont entièrement personnalisables, vous offrant la flexibilité d'adapter l'affichage à votre style de trading personnel.
این اندیکاتور طراحی شده تا نقاط باز شدن کندلهای تایمفریمهای بالاتر را بسته به تایمفریم فعلی شما به هم متصل کند:
- اگر تایمفریم کمتر از یک ساعت باشد → باز شدن کندلهای روزانه را به هم وصل میکند.
- اگر تایمفریم چهارساعته باشد → باز شدن کندلهای هفتگی را به هم وصل میکند.
- اگر تایمفریم بزرگتر از چهارساعته و کوچکتر از هفتگی باشد → باز شدن کندلهای ماهانه را به هم وصل میکند.
این ویژگی به معاملهگر کمک میکند تا به سادگی سطوح مهم شروع دورههای بزرگتر (روزانه، هفتگی، ماهانه) را روی نمودار مشاهده کند. این سطوح اغلب بهعنوان نقاط کلیدی حمایت و مقاومت، شروع روندهای جدید یا محدودههای معاملاتی مهم در نظر گرفته میشوند.
با تنظیم رنگ، ضخامت و نوع خط، میتوانید نمایش این خطوط را مطابق با سبک معاملاتی خود شخصیسازی کنید.