present
Registrati e ricevi uno sconto da $50 sul tuo primo acquisto
Trading product for IR Spread Indicatore, image 1
IR Spread
5.0
Recensioni: 2
5.66K
Installazioni gratuite

Descrizione

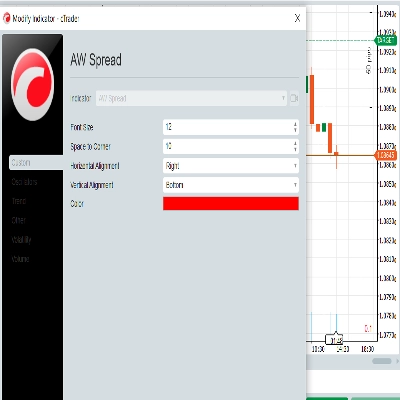
mostra lo spread all'aggiornamento del grafico

Telegram Channel supportaci per più indicatori e bot gratuiti

Riepilogo

Riepilogo AI
IR Spread is a trading indicator designed to display the spread directly on the chart during updates. It provides real-time visualization of the spread, helping traders monitor this key metric within their trading platform interface. The indicator integrates seamlessly with chart updates, ensuring that spread information is current and easily accessible.
Profilo indicatore

Discussioni

Recensioni dei clienti

5.0
Recensioni: 2
5
100 %
4
0 %
3
0 %
2
0 %
1
0 %
Recensioni dei clienti
June 4, 2026
didn't check deep enough so far but it seems perfect and smooth
November 18, 2025

Domande frequenti

I prodotti disponibili tramite cTrader Store, inclusi bot di trading, indicatori e plugin, sono forniti da sviluppatori terzi e resi disponibili esclusivamente a scopo informativo e di accesso tecnico. cTrader Store non è un broker e non fornisce consulenze in materia di investimento, raccomandazioni individualizzate o garanzie di risultati futuri.

Altro da questo autore
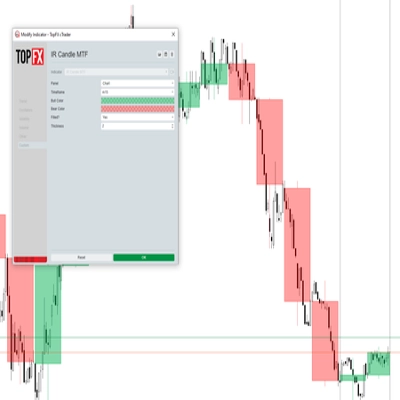
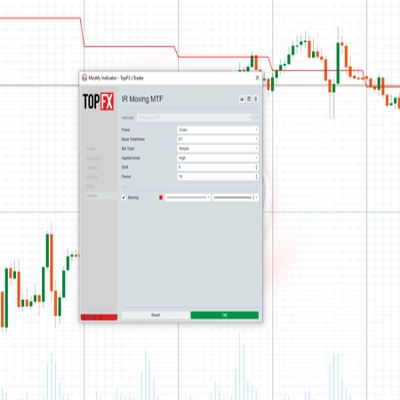
with this indicator you could see other time frame candle in your chart.
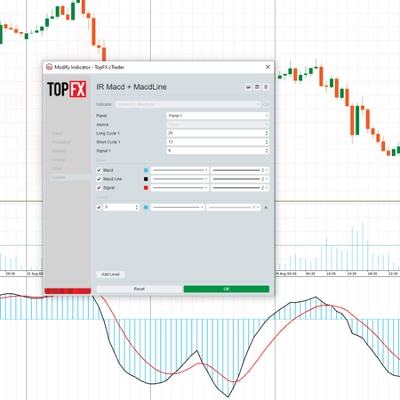
some user add moving average to macd to see better. in ctrader 4.3.11 there is a problem with this . I make a macd tha
this indicator show macd on chart.
Multi Time Frame Moving Average is a powerful and flexible indicator for cTrader
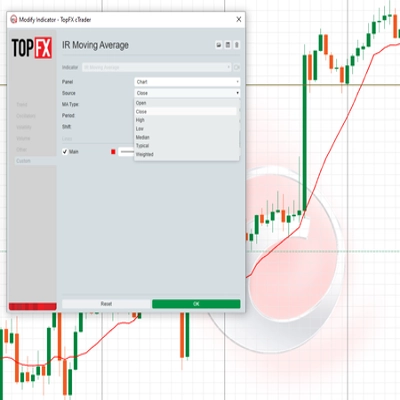
 this moving include everything that a trader needs from Moving Average.
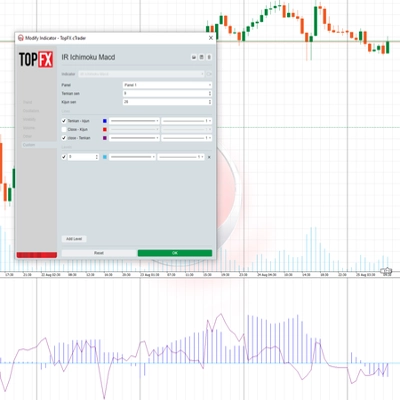
this indicaotr show distance between Tenkan to Kijun, Close to Kijun and Close to Tenkan 
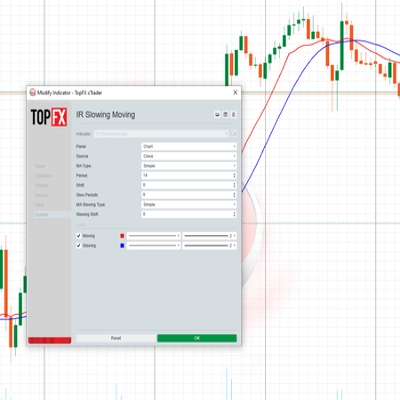
Add Slowing to IR Moving Average.
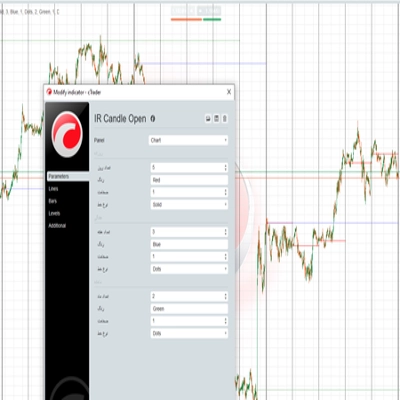
IR Candle Open plots customizable opening price lines for daily, weekly, and monthly candles
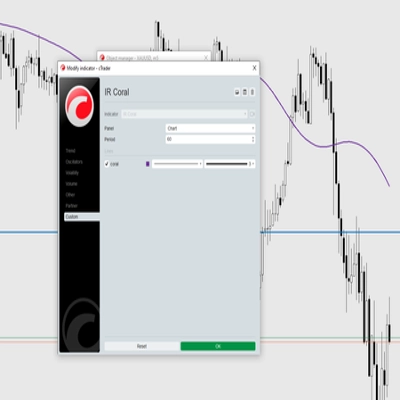
Coral indicator
you could put your check list in your chart you could split your test with “,” you could put your checklist in indicat
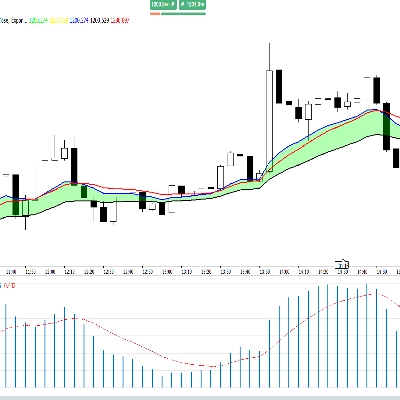
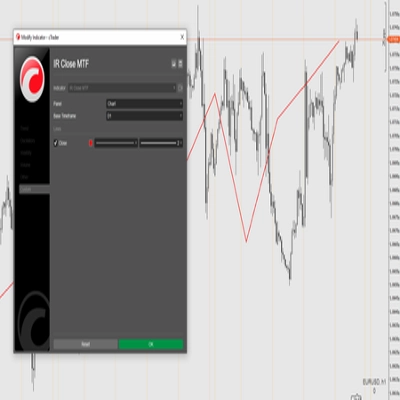
this indicator show other time frame close in lower time frame. for ex: show daily close in m 15.
don't move to the end of chart after timeframe changing. it should be better to use for near history. for long history

Potrebbe interessarti anche

Market Cipher B
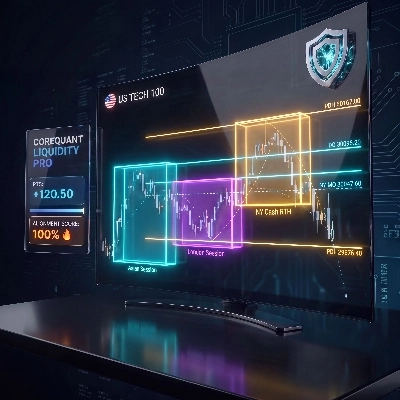
Institutional Nasdaq Session Liquidity Map with Live Point HUD, Sweep Alerts & Interactive Playbook.
Algorithmic trend precision for cTrader.
you could put your check list in your chart you could split your test with “,” you could put your checklist in indicat
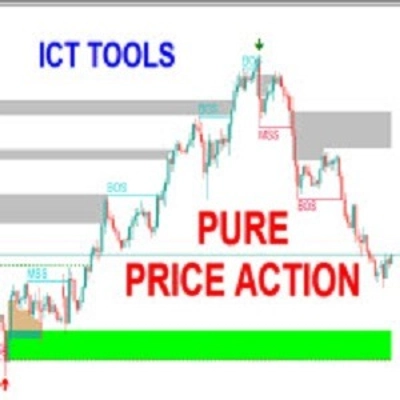
Pure Price Action ICT Tools
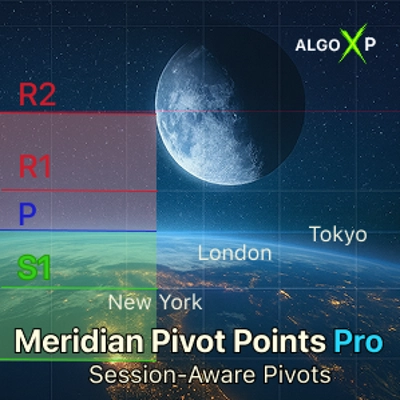
🚀See the market’s framework, decide faster. Session-Aware Pivots. Auto Presets. Pro-Grade Zones.🚀
See the day's percentage targets from the open, so you know where the session stands at a glance.
ZigZag filters noise, spots trends, patterns, pivots, aiding analysis, trade management, and confirmations. 📉📈
PrimeTrend: ATR trendline detects reversals, plots entry/SL/3 targets. Tune params (speed vs. robustness). Backtest +
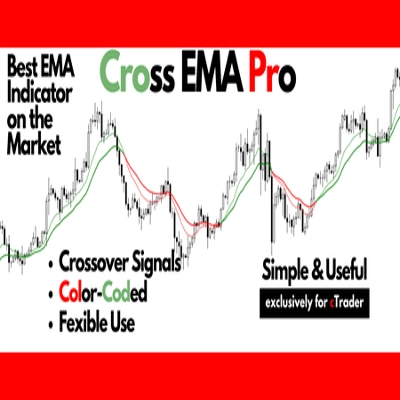
Cross EMA Pro – Trend Reversal Indicator
🚀 MACARX Indicator - The Multi-Indicator Trend Fusion 🚀
Candle Timer best used for Scalper
Map market structure, order blocks, liquidity and key zones with an interactive cTrader dashboard.
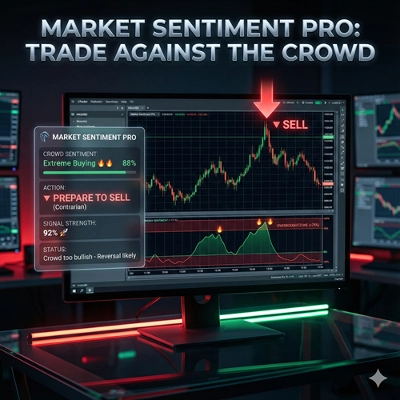
Market Sentiment Pro: Predict tops & bottoms using crowd psychology. Contrarian signals with 70-80% accuracy. Early Acce
Add your provider's gamma levels by hand or automatically with our feed plugin, and see the gamma regime at a glance.
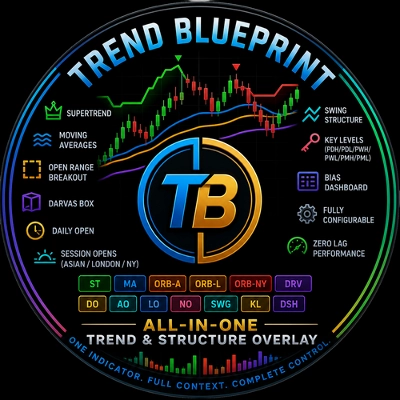
Trend Blueprint All-in-One Trend & Structure
Trading.FC$_vwap Algo shows VWAP trends, dynamic support/resistance and deviation bands to spot potential trade entries.
MACD Indicator with Histogram that plots Colors Based on Direction Above and Below the Zero Line.

Prezzo

5.66K
Installazioni gratuite