Description
HTF Bias Detector — Panel Edition
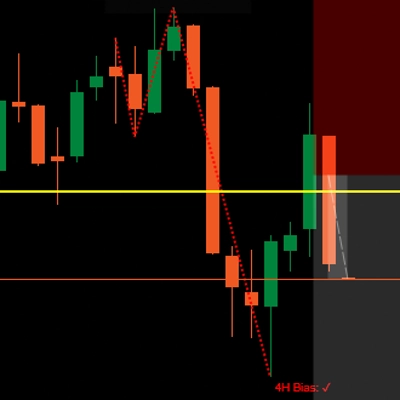
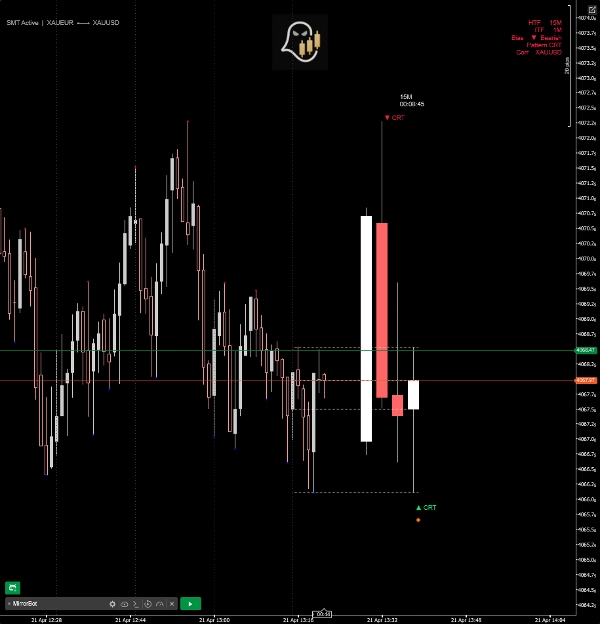
See the higher timeframe story at a glance. HTF Bias Detector renders the last N higher-timeframe candles in a floating panel directly on your chart — no need to switch timeframes — and automatically identifies the dominant bias using four institutional price action patterns.
How It Works
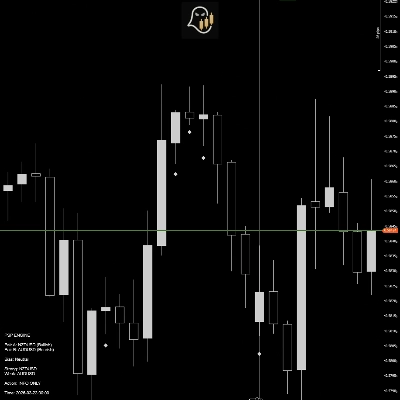
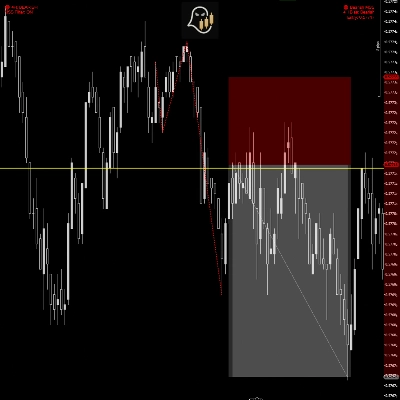
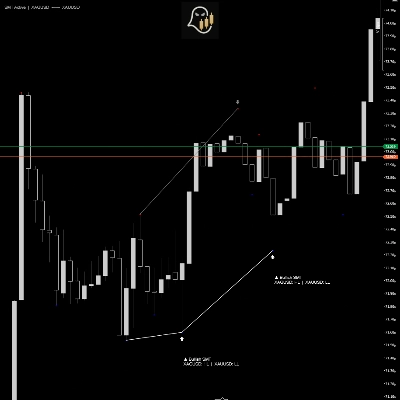
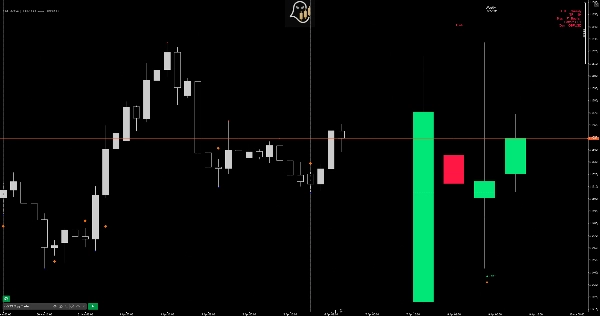
The indicator maps your current chart timeframe to its natural higher timeframe (e.g. 5M → 1H, 1H → Daily) and draws those HTF candles in a clean panel anchored to the right of price. Pattern detection then runs on those candles in real time.
Detected Patterns
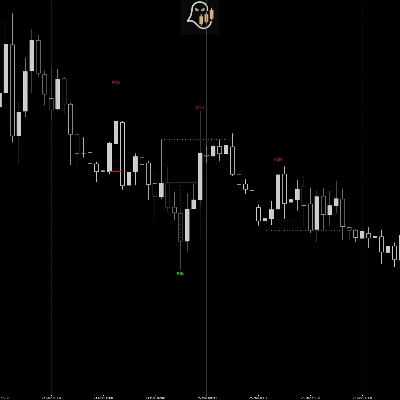
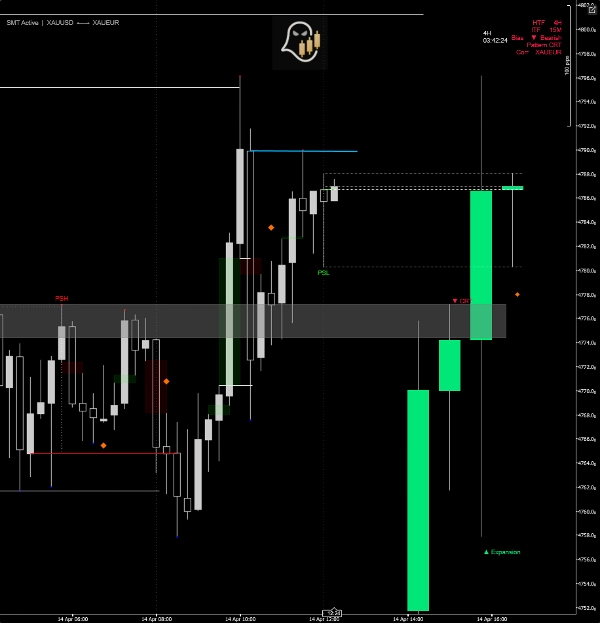
- CRT (Candle Range Theory) — identifies trap candles that sweep a prior high or low and close back inside, signalling a likely reversal.
- Expansion — flags candles that engulf the prior range entirely and close beyond it, confirming directional momentum.
- Swing Point — detects three-candle sequences where a displacement candle is followed by a strong reversal, marking a structural turning point.
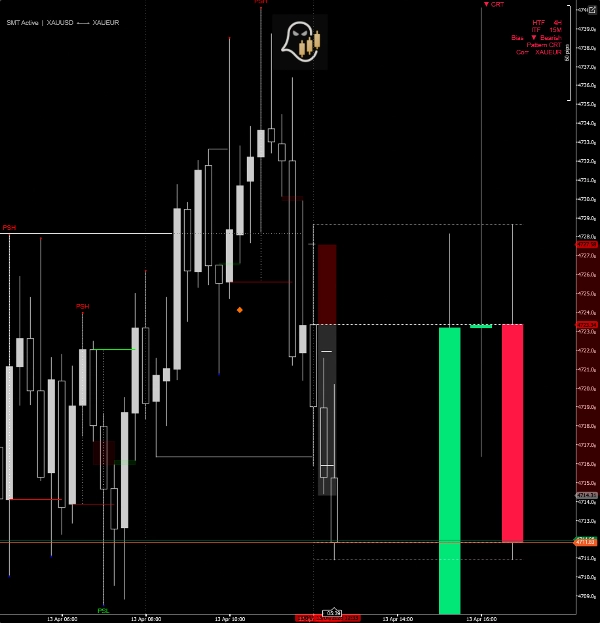
- PSP (Precision Swing Point) — cross-pair divergence signal. When the primary symbol and its correlated pair print opposing directional candles at the same HTF bar, a PSP diamond is plotted.
SMT Divergence (HTF Panel)
Compares consecutive HTF candle pairs between correlated instruments. When one pair makes a lower low while the other makes a higher low (or vice versa on highs), an SMT divergence line is drawn directly on the panel with a directional label.
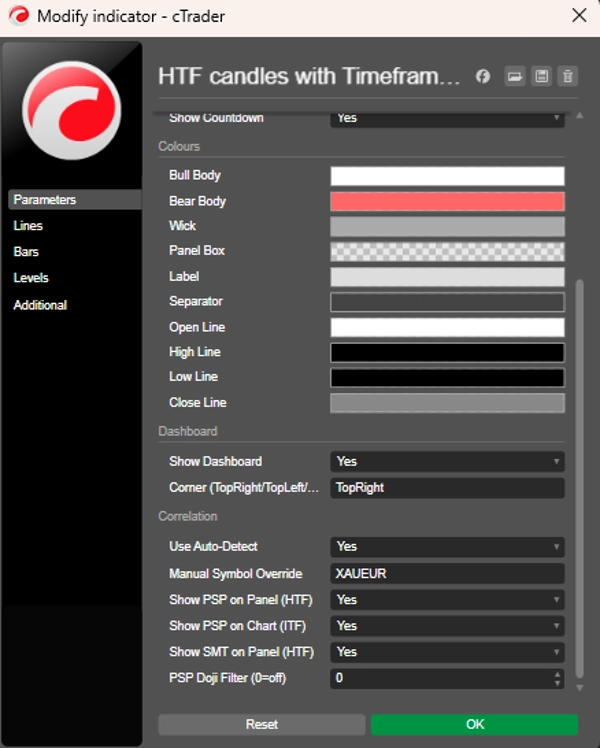
Correlated Pair Auto-Detection
Automatically resolves the correlated instrument for your chart symbol — covering major forex pairs, metals, indices, and crypto. A manual override is also available for custom pairings or broker-specific symbol names.
Additional Features
- Live countdown timer to the next HTF candle close
- OHLC dotted reference lines for the currently forming HTF candle
- Vertical separators on the live chart aligned to HTF open times
- Compact dashboard showing HTF, ITF, detected bias, pattern name, and correlated pair
- ITF PSP diamonds plotted directly on chart bars (current timeframe)
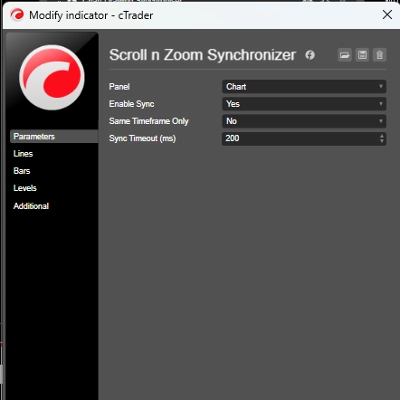
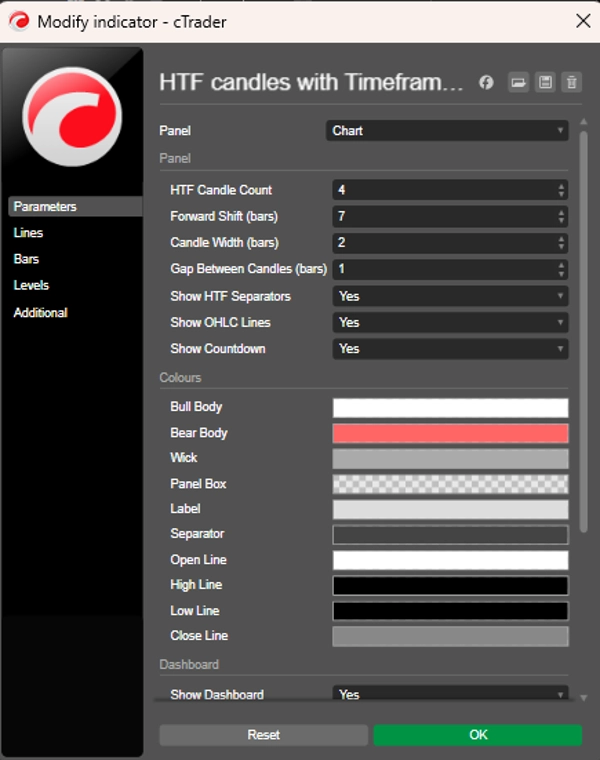
- Fully customisable colours, panel width, candle count, and positioning
- Doji filter to suppress weak PSP signals
Timeframe Map
Chart TF HTF Panel
1M – 4M 15M
5M – 10M 1H
15M – 30M 4H
1H Daily
4H Weekly
Daily Monthly
Summary
The indicator detects four institutional price action patterns in real time on these HTF candles: Candle Range Theory (CRT) trap candles signaling reversals, Expansion candles confirming momentum, Swing Point sequences marking structural turns, and Precision Swing Point (PSP) diamonds indicating cross-pair divergences. It also identifies SMT (Smart Money Technique) divergences between correlated instruments by comparing consecutive HTF candle pairs.
Correlated pairs are auto-detected for major forex pairs, metals, indices, and cryptocurrencies, with manual override options available. Additional features include a live countdown timer to the next HTF candle close, OHLC reference lines, vertical HTF open time separators, a compact dashboard showing HTF and intermediate timeframe bias and patterns, and customizable visual settings. The indicator supports multiple markets including forex, indices, and commodities.
Customer reviews
5 | 50 % | |
4 | 50 % | |
3 | 0 % | |
2 | 0 % | |
1 | 0 % |