
Golden Boom And Crash Spike Detector
Indicateur
15 achats
Version 2.0, Apr 2026
Windows, Mac
5.0
Avis : 3
Description
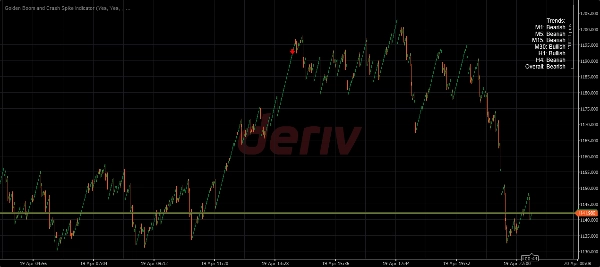
Le détecteur de pics Golden Boom and Crash est un indicateur avancé de trading sur les synthétiques qui combine une détection de pics pilotée par une IA propriétaire et une analyse de l'action des prix pour fournir des signaux de trading à haute probabilité avec une précision inégalée.
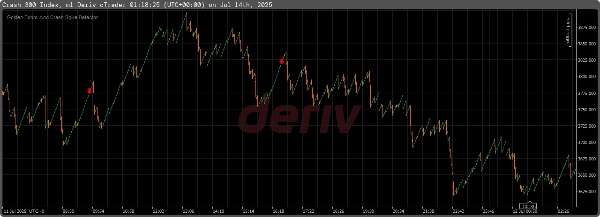
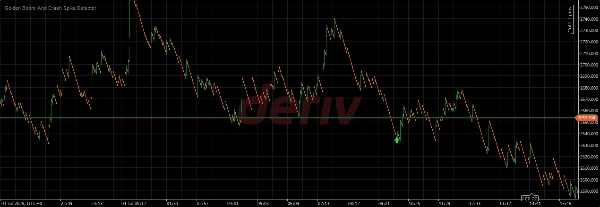
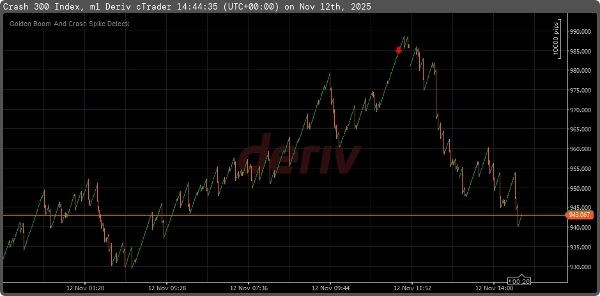
- Important (Utiliser uniquement sur Crash 300, Boom 300 (échelle de temps M1 une minute)
- Identifie les pics à haute probabilité avec des flèches d'achat/vente non repeintes sur le graphique
- Envoie des notifications au téléphone et à l'ordinateur
- Fonctionne sur le broker Deriv
- Dépôt minimum 30 $
- Affiche la direction de la tendance de M1 à H4
- Envoie les niveaux de stop loss, take profit (Tp1, Tp2, Tp3) et la direction de la tendance au téléphone et à l'ordinateur
- Affiche des boîtes de message à l'écran et des notifications pop-up standard
- Joue une notification sonore lorsqu'un nouveau signal est généré
Résumé
Résumé IA
Golden Boom and Crash Spike Detector is a trading indicator designed specifically for the Crash 300 and Boom 300 indices on the 1-minute (M1) timeframe. It uses AI-driven spike detection combined with price action analysis to identify high-probability market spikes. The tool provides non-repainting buy and sell arrows directly on the chart, helping traders spot potential entry points. It integrates with Deriv platforms and supports sending notifications—including stop loss, take profit levels (Tp1, Tp2, Tp3), and trend direction—from M1 up to H4 timeframes to both phone and computer. The indicator also features on-screen message boxes, standard pop-up alerts, and sound notifications when new signals are generated. It requires a minimum deposit of $30 on the Deriv broker. This tool is intended to assist traders focusing on synthetic indices by delivering timely and actionable spike signals with trend context.
Profil de l'indicateur
Avis clients
5.0
Avis : 3
5 | 100 % | |
4 | 0 % | |
3 | 0 % | |
2 | 0 % | |
1 | 0 % |
Avis clients
July 17, 2025
Simple market helper for a more controlled workflow. It helps with handling gold setups with more structure, but gold can move fast, so DD and position sizing matter a lot. For gold, I would use 0.5 percent risk, a 1.5R target and DD under 3 percent before scaling. I would still keep manual review in the process.
July 16, 2025
July 16, 2025
Not bad for a trial around gold trading. The useful part is handling gold setups with more structure, with the numbers checked before scaling. The setup is easier to judge after 25 XAUUSD trades, especially if ROI sits around 4 to 6 percent. Gold volatility can make one bad trade expensive, so a 1 percent cap per trade feels sensible.
Discussion
Questions fréquentes
Forex
Signal
Indices
SMC
BOS
AI
Les produits disponibles sur cTrader Store, notamment les bots de trading, les indicateurs et les plug-ins, sont fournis par des développeurs tiers et mis à disposition à titre informatif et à des fins d'accès technique uniquement. cTrader Store n'est pas un courtier et ne fournit aucun conseil en investissement, aucune recommandation personnelle ni aucune garantie quant aux performances futures.
Plus de cet auteur


![Logo de "High-Low Divergence [Iridio Capital]"](https://cdn.ctrader.com/image/webp/443c4661-7abb-40f1-842f-4b6ec560649b_40914)


Prix
32
Ventes