
Inside Candle
지표
1 구매
버전 1.0, Oct 2025
Windows, Mac
5.0
리뷰: 2
설명
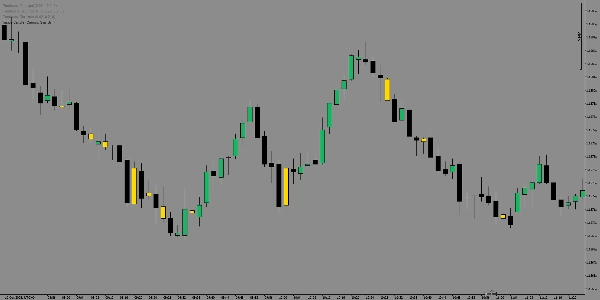
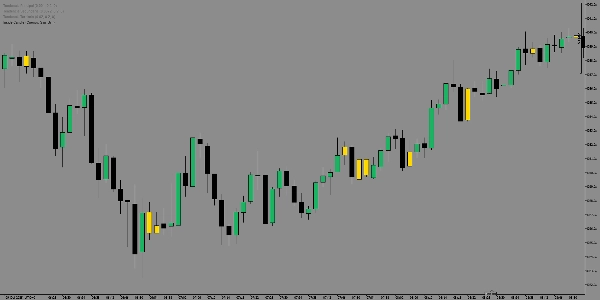
정확하게 강력한 돌파 구역과 시장 통합 구간을 식별하려면 Inside Candle Indicator를 사용하세요.
이 도구는 모든 Inside Bar 패턴— 변동성이 축소되고 시장이 폭발적인 움직임을 준비하는 순간을 강조합니다.
캔들의 고가와 저가가 이전 캔들 안에 완전히 포함될 때를 감지하여, 축적 또는 우유부단 구역을 시각적으로 표시하며, 발생하기 전에 잠재적 돌파 지점을 예측하는 데 도움을 줍니다.
다음과 같이 사용하세요:
- 추세 지속 설정과 초기 반전을 포착하세요.
- 변동성 압축 구역으로 거래를 필터링하세요.
- 시장이 다음 움직임을 위해 “에너지를 충전”하는 순간을 즉시 인식하세요.
깔끔하고 정확하며 시각적으로 직관적인 — Inside Candle Indicator는 복잡한 시장 구조를 간단한 시각적 통찰로 바꿉니다.
요약
AI 요약
The Inside Candle indicator identifies Inside Bar patterns by detecting when a candle’s high and low are fully contained within the previous candle. This highlights zones of market consolidation and volatility contraction, signaling potential breakout points. It visually marks areas of accumulation or indecision, helping traders anticipate trend continuations or early reversals. The indicator supports markets including Forex, commodities, indices, and symbols such as EURUSD, GBPUSD, USDJPY, BTCUSD, XAUUSD, and NAS100. Key features include filtering trades by volatility compression zones and providing clear, intuitive visual cues to recognize when the market is preparing for significant moves. This tool is designed to simplify complex market structures into actionable insights for breakout and trend-following strategies.
지표 프로필
고객 리뷰
5.0
리뷰: 2
5 | 100 % | |
4 | 0 % | |
3 | 0 % | |
2 | 0 % | |
1 | 0 % |
고객 리뷰
October 22, 2025
October 21, 2025
The better read comes from the process slows down in a good way. It should stay in the support stack.
상담
자주 묻는 질문(FAQ)
BTCUSD
Forex
Signal
Breakout
Indices
EURUSD
Commodities
GBPUSD
NZDUSD
RSI
Fibonacci
Scalping
XAUUSD
NAS100
ATR
MACD
USDJPY
VWAP
트레이딩 봇, 지표, 플러그인 등 cTrader Store에서 제공되는 상품은 제3자 개발자에 의해 제공되며, 이는 단순히 정보 및 기술적 접근을 목적으로 제공된 것입니다. cTrader Store는 중개인이 아니며, 투자 조언, 개인별 추천 또는 향후 성과에 대한 어떠한 보장도 제공하지 않습니다.
이 작성자의 상품 더 보기


!["[Hamster-Coder] Bollinger Bands" 로고](https://cdn.ctrader.com/image/webp/21d8e5d6-fb11-4bac-b9ee-cd05c2b76804_30327)

가격
가입일 11/10/2025
2.55M
거래량
17.52K
핍 수익
1
판매
231
무료 설치