
KANDIKA HEAT MAP
Indicateur
1 achats
Version 1.0, Jul 2025
Windows, Mac
4.6
Avis : 3
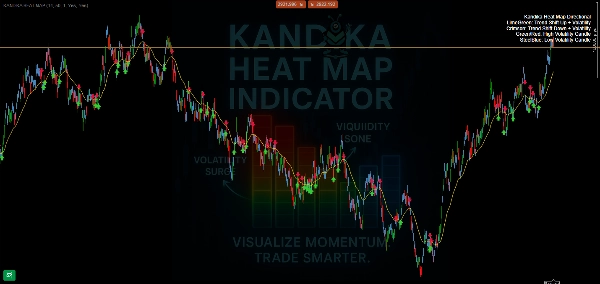
🎨 Logique des couleurs – Ce qu’elle vous dit
- 🟩 Vert citron → Changement de tendance à la hausse
Un changement de momentum haussier est en train de se former. Utilisez-le pour saisir une hausse précoce. - 🟥 Cramoisi → Changement de tendance à la baisse
Signale une pression à la baisse qui se renforce. Vous prépare à d’éventuelles positions courtes ou sorties. - 🟧/🔴 Orange/Rouge → Zone de forte volatilité
Attendez-vous à des pics de prix, des mouvements rapides et des pièges potentiels. Ce n’est pas un endroit pour deviner à l’aveugle—confirmez votre stratégie. - 🟦 Bleu acier → Zone de faible volatilité
Le marché ralentit, se comprime ou évolue en range. Prépare souvent des opportunités de cassure.
📊 Ce qu’il fait (et ne fait pas)
- ✅ Cartographie claire des changements de direction de tendance
- ✅ Sépare visuellement les zones calmes des zones volatiles
- ✅ Superposition simple et adaptée aux graphiques—sans encombrement
Profil de l'indicateur
4.6
Avis : 3
5 | 67 % | |
4 | 33 % | |
3 | 0 % | |
2 | 0 % | |
1 | 0 % |
Avis clients
August 4, 2025
No reason to yolo this live without a few normal sessions, and Bad settings can ruin the idea.
July 26, 2025
20 percent less clicking is the line to watch. Market checks feel quicker.
Les produits disponibles sur cTrader Store, notamment les bots de trading, les indicateurs et les plug-ins, sont fournis par des développeurs tiers et mis à disposition à titre informatif et à des fins d'accès technique uniquement. cTrader Store n'est pas un courtier et ne fournit aucun conseil en investissement, aucune recommandation personnelle ni aucune garantie quant aux performances futures.


Depuis le 08/06/2025
1
Ventes