
IR Ichimoku Macd
Indicateur
221 téléchargements
Version 1.0, Jan 2025
Windows, Mac
5.0
Avis : 1
Description
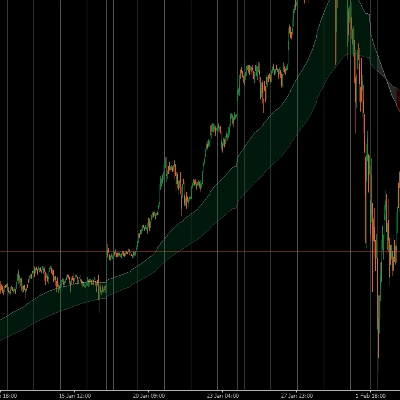
cet indicateur montre la distance entre Tenkan et Kijun, la clôture par rapport à Kijun et la clôture par rapport à Tenkan
Résumé
Profil de l'indicateur
Avis clients
5.0
Avis : 1
5 | 100 % | |
4 | 0 % | |
3 | 0 % | |
2 | 0 % | |
1 | 0 % |
Avis clients
August 18, 2025
Pros: Combines Ichimoku and MACD for both trend and momentum analysis. Flexible settings and clear visualization. Cons: No alerts, MTF mode, or preset saving. Can be resource-heavy on low-end PCs.
Discussion
Questions fréquentes
Les produits disponibles sur cTrader Store, notamment les bots de trading, les indicateurs et les plug-ins, sont fournis par des développeurs tiers et mis à disposition à titre informatif et à des fins d'accès technique uniquement. cTrader Store n'est pas un courtier et ne fournit aucun conseil en investissement, aucune recommandation personnelle ni aucune garantie quant aux performances futures.
Plus de cet auteur


![Logo de "Smart Money Concepts (SMC) [Iridio Capital]"](https://cdn.ctrader.com/image/webp/28b69fd1-ef54-4bed-9487-07e78e883be4_40934)


Prix
5.12K
Installations gratuites