
Açıklama
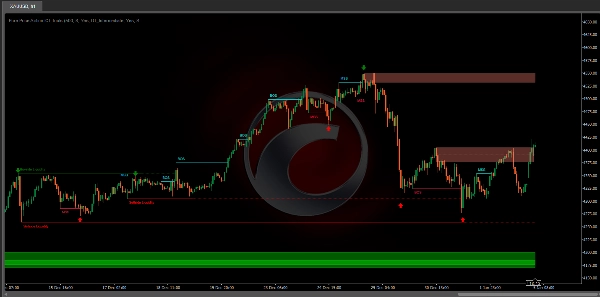
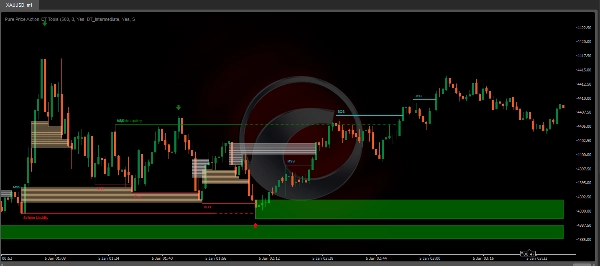
The Pure Price Action ICT Tools göstergesi saf fiyat hareketi analizi için tasarlanmıştır ve gerçek zamanlı piyasa yapıları, likidite seviyeleri, emir & kırıcı bloklar ve likidite boşluklarını otomatik olarak tanımlar.
Benzersiz özelliği, kullanıcı tarafından tanımlanan herhangi bir girdiye bağlı kalmadan yalnızca fiyat desenlerine dayanmasıdır; bu da piyasa dinamiklerinin sağlam ve objektif bir analizini sağlar.
Ana Özellikler
- Piyasa Yapıları
Piyasa Yapısı Değişimi, Karakter Değişikliği (CHoCH) olarak da bilinir, fiyat hareketi analizinde piyasa duyarlılığı veya yönünde potansiyel bir değişikliği gösteren kritik bir olaydır. Bir MSS, fiyatın yerleşik bir trendden dönmesiyle gerçekleşir ve mevcut trendin momentumunu kaybediyor olabileceğini ve bir dönüşün olabileceğini işaret eder. Bu değişim genellikle, düşüş trendinde daha yüksek dip veya yükseliş trendinde daha düşük tepe gibi önemli teknik desenlerle tanımlanır ve mevcut trendin gücünün zayıfladığını gösterir.
Yapı Kırılması genellikle mevcut piyasa trendinin devamını gösterir. Bu olay, fiyatın önceki bir salınım yüksek veya düşük seviyesini kararlı bir şekilde aşmasıyla gerçekleşir ve mevcut trendin gücünü doğrular. Yükseliş trendinde, bir BOS fiyatın önceki bir yüksek seviyeyi aşmasıyla işaretlenirken, düşüş trendinde fiyatın önceki düşük seviyenin altına inmesiyle tanımlanır.
Bir Piyasa Yapısı Değişimi (MSS) potansiyel bir trend dönüşünü gösterebilirken ve Yapı Kırılması (BOS) genellikle trend devamını doğrulasa da, bunlar tam bir dönüş veya devamı garanti etmez. MSS ve BOS seviyeleri, piyasa yönündeki değişikliği kesin olarak işaret etmekten ziyade likidite bölgeleri veya fiyat konsolidasyon alanları olarak da işlev görebilir. Tüccarlar bu sinyallere temkinli yaklaşmalı ve ticaret kararları vermeden önce ek faktörlerle doğrulamalıdır. Araçtaki diğer bileşenler hakkında daha fazla bilgi için lütfen aşağıdaki bölümlere bakınız.
- Emir & Kırıcı Bloklar
Emir ve Kırıcı Bloklar, fiyat hareketi analizinde tüccarların piyasa yapısındaki önemli seviyeleri tanımlamasına yardımcı olan temel kavramlardır.
Emir Blokları, önemli alım veya satım faaliyetinin gerçekleştiği belirli fiyat bölgeleridir. Bu bölgeler genellikle büyük kurumsal tüccarların veya piyasa yapıcıların önemli emirler verdiği ve piyasa üzerinde etkisi olan alanları temsil eder.
Kırıcı Bloklar, güçlü bir dönüşün gerçekleştiği ve mevcut piyasa yapısında kırılmaya neden olan belirli fiyat bölgeleridir. Bu bloklar, fiyatın önemli direnç veya destekle karşılaştığı ve dönüşe yol açtığı alanları gösterir.
Özetle, alım tarafı ve satım tarafı likidite, piyasa talep ve arz dinamikleri hakkında kritik bilgiler sağlar ve tüccarların farklı fiyat seviyelerindeki emirlerin varlığına dayanarak bilinçli kararlar vermesine yardımcı olur.
- Alım ve Satım Tarafı Likiditesi
Hem alım tarafı hem de satım tarafı likidite bölgeleri, piyasadaki potansiyel dönüş noktalarını belirlemek için kritiktir. Bu bölgeler, önemli alım veya satım ilgisinin yoğunlaştığı ve gelecekteki fiyat hareketlerini etkileyen alanlardır.
Özetle, alım tarafı ve satım tarafı likidite, piyasa talep ve arz dinamikleri hakkında kritik bilgiler sağlar ve tüccarların farklı fiyat seviyelerindeki emirlerin varlığına dayanarak bilinçli kararlar vermesine yardımcı olur.
- Likidite Boşlukları
Likidite boşlukları, fiyat grafiğinde işlem aktivitesinin eksik olduğu boşluklar veya alanlardır. Bu boşluklar, alım veya satım emirlerinin çok az veya hiç olmadığı bölgeleri temsil eder ve piyasa bu alanlara girdiğinde keskin fiyat hareketlerine yol açabilir.
Özetle, likidite boşlukları, işlem aktivitesinin eksik olduğu fiyat grafiğinde kritik alanlardır. Bu boşluklar hızlı fiyat hareketlerine ve artan volatiliteye neden olabilir, bu yüzden tüccarlar için analiz ve karar verme süreçlerinde önemli birer unsurdur.
- Salınım Noktaları
Dönüş fiyat noktalarına genellikle salınım noktaları denir. Tüccarlar, piyasa trendlerini anlamak ve potansiyel işlem giriş ve çıkış noktalarını belirlemek için geçmiş salınım noktalarını analiz ederler.
Bu betikte, salınım noktalarının tespit edildiği yerden farklı bir yerde gösterilmesi (back painting) söz konusudur.
Salınım noktalarının tespiti ve bu betiğin benzersiz özelliği tamamen fiyat hareketine dayanır, sayısal kullanıcı tanımlı ayarlara ihtiyaç duymaz. İşlem, kısa vadeli salınım noktalarının tespitiyle başlar:
- Kısa Vadeli Salınım Tepesi (STH): Her iki tarafında daha düşük tepelerle çevrili bir fiyat zirvesi olarak tanımlanır.
- Kısa Vadeli Salınım Dibi (STL): Her iki tarafında daha yüksek diplerle çevrili bir fiyat çukuru olarak tanınır.
Orta ve uzun vadeli salınım noktaları aynı yöntemle ancak küçük bir değişiklikle tespit edilir. Doğrudan fiyat mumları yerine, önceden tespit edilmiş kısa vadeli salınım noktaları kullanılır. Orta vadeli salınım noktaları için kısa vadeli noktalar, uzun vadeli salınım noktaları için ise orta vadeli noktalar analiz edilir.
Bu yöntem, piyasa dinamiklerinin sağlam ve objektif bir analizini sağlar ve tüccarlara piyasa yapıları hakkında güvenilir bilgiler sunar. Tespit edilen salınım noktaları, bu araçla sunulan piyasa yapıları, alım/satım tarafı likidite seviyeleri ve emir ile kırıcı blokların belirlenmesinde temel oluşturur.
Özetle, salınım noktaları teknik analizde önemli unsurlardır ve tüccarların trendleri, destek ve direnç seviyelerini ve optimal giriş-çıkış noktalarını belirlemesine yardımcı olur. Salınım noktalarını anlamak, tüccarların piyasanın doğal fiyat hareketlerine dayanarak bilinçli kararlar vermesini sağlar.
Ayarlar
- Piyasa Yapıları
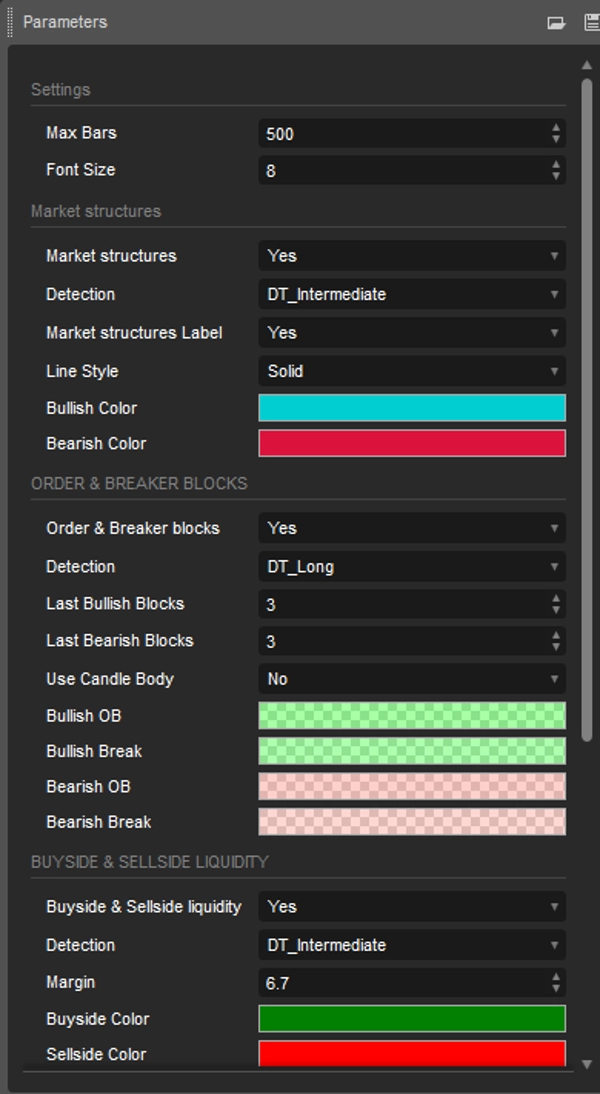
Piyasa Yapıları: Hem yapı değişimlerinin hem de kırılmaların görünürlüğünü açar/kapatır.
Tespit: Kullanıcıların kısa vadeli, orta vadeli ve uzun vadeli salınım seviyelerinin önemine göre piyasa yapıları tespit etmesine olanak tanıyan bir seçenektir.
Piyasa Yapısı Etiketleri: Piyasa yapısı türünü vurgulayan etiketlerin görünürlüğünü kontrol eder.
Çizgi Stili: Piyasa yapısını temsil eden çizgilerin stilini özelleştirir.
- Emir & Kırıcı Bloklar
Emir & Kırıcı Bloklar: Emir ve kırıcı blokların görünürlüğünü açar/kapatır.
Tespit: Kullanıcıların kısa vadeli, orta vadeli ve uzun vadeli salınım seviyelerinin önemine göre emir ve kırıcı blokları tespit etmesine olanak tanıyan bir seçenektir.
Son Boğa Blokları: Grafikte gösterilecek en son boğa emir/kırıcı bloklarının sayısı.
Son Ayı Blokları: Grafikte gösterilecek en son ayı emir/kırıcı bloklarının sayısı.
Mum Gövdesi Kullanımı: Kullanıcıların tam mum aralığı yerine mum gövdelerini emir bloğu alanları olarak kullanmasına izin verir.
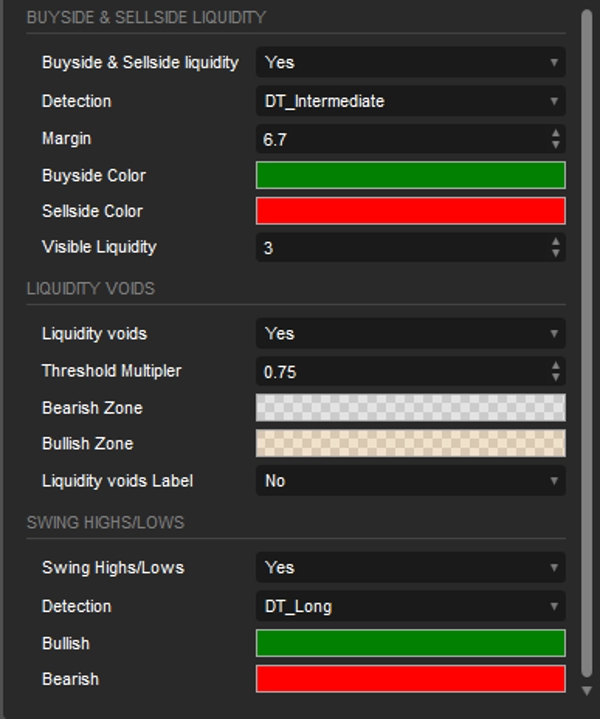
- Alım ve Satım Tarafı Likiditesi
Alım ve Satım Tarafı Likiditesi: Alım ve satım tarafı likidite seviyelerinin görünürlüğünü açar/kapatır.
Tespit: Kullanıcıların kısa vadeli, orta vadeli ve uzun vadeli salınım seviyelerinin önemine göre alım ve satım tarafı likiditeyi tespit etmesine olanak tanıyan bir seçenektir.
Marj: Likidite seviyesi tespiti için marj/duyarlılık ayarlar.
Görünür Likidite: Görselleştirilecek likidite seviyeleri/bölgelerinin miktarını kontrol eder.
- Likidite Boşlukları
Likidite Boşlukları: Hem boğa hem de ayı likidite boşluklarının görüntülenmesini etkinleştirir.
Eşik Çarpanı: 200 periyotluk ATR aralığına sabitlenmiş eşik için çarpanı tanımlar.
Etiket: Likidite boşluklarını gösteren bir etiketin görüntülenmesini etkinleştirir.
- Salınım Noktaları
Salınım Tepeleri/Dipleri: Salınım seviyelerinin görünürlüğünü açar/kapatır.
Tespit: Kullanıcıların kısa vadeli, orta vadeli ve uzun vadeli salınım seviyelerinin önemine göre salınım seviyelerini tespit etmesine olanak tanıyan bir seçenektir.
Özet
Key functionalities include:
- Market Structures: Detects Market Structure Shifts (potential trend reversals) and Breaks of Structure (trend continuations) based on price patterns.
- Order & Breaker Blocks: Highlights significant price zones where institutional buying/selling or strong reversals occur.
- Buy-side & Sell-side Liquidity: Identifies zones of concentrated buying or selling interest that may influence price movements.
- Liquidity Voids: Marks price chart gaps with minimal trading activity, often leading to sharp price moves.
- Swing Points: Detects short-, intermediate-, and long-term reversal points to aid in trend analysis and trade decision-making.
The tool offers customizable settings to toggle visibility and detection sensitivity for each feature, including options to adjust detection based on swing level significance and display preferences. It supports analysis across various markets such as Forex, Crypto (e.g., BTCUSD), and indices (e.g., NAS100, XAUUSD). The indicator provides an objective framework for analyzing market dynamics based solely on price action patterns.
Müşteri değerlendirmeleri
5 | 67 % | |
4 | 0 % | |
3 | 33 % | |
2 | 0 % | |
1 | 0 % |


