Описание
ОБЗОР
Индикатор Waddah Attar Explosion (WAE) был создан Ахмадом Ваддахом Аттаром и представлен торговому сообществу в 2007 году. Он сочетает измерение импульса MACD с анализом волатильности полос Боллинджера для выявления моментов "взрыва цены" — периодов, когда цена переходит от консолидации к сильному направленному движению.
Индикатор отвечает на два вопроса:
- Нарастает ли импульс? (измеряется скоростью изменения MACD)
- Расширяется ли волатильность? (измеряется шириной полос Боллинджера)
Когда оба условия совпадают выше фильтра шума (Мертвая зона), это сигнализирует о потенциальном взрывном движении.
КОМПОНЕНТЫ
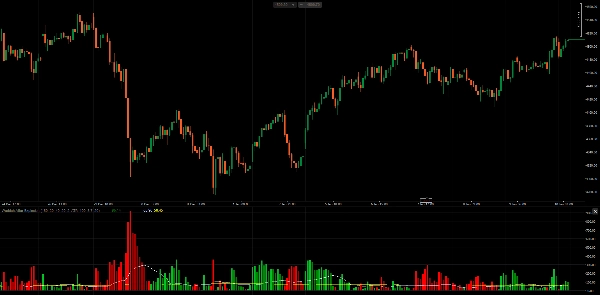
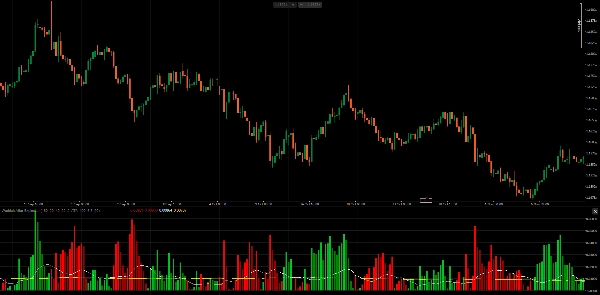
1. Гистограмма тренда (Зеленая/Красная) Отображает скорость изменения линии MACD, умноженную на коэффициент чувствительности.
- Расчет:
(MACD_current - MACD_previous) × Sensitivity - Зеленые бары: Бычий импульс (ускорение MACD вверх)
- Красные бары: Медвежий импульс (ускорение MACD вниз)
- Яркий цвет: Импульс увеличивается по сравнению с предыдущим баром
- Темный цвет: Импульс уменьшается по сравнению с предыдущим баром
2. Линия взрыва (Белая) Представляет ширину полос Боллинджера, указывая на расширение или сжатие волатильности.
- Расчет:
BB_Upper - BB_Lower - Растет: Волатильность расширяется (потенциальный прорыв)
- Падает: Волатильность сжимается (консолидация)
3. Мертвая зона (Желтая) Пороговый фильтр для устранения слабых сигналов, вызванных рыночным шумом.
- На основе ATR: Адаптируется к текущей волатильности рынка
- Фиксированные пипсы: Статическое пороговое значение
КАК АХМАД ВАДДАХ АТТАР ИСПОЛЬЗУЕТ ЕГО
По словам оригинального автора:
Правила входа для покупки Все условия должны быть выполнены:
- Зеленая гистограмма растет
- Зеленая гистограмма находится выше линии взрыва
- Линия взрыва растет
- И зеленая гистограмма, и линия взрыва находятся выше мертвой зоны
Правила входа для продажи Все условия должны быть выполнены:
- Красная гистограмма растет
- Красная гистограмма находится выше линии взрыва
- Линия взрыва растет
- И красная гистограмма, и линия взрыва находятся выше мертвой зоны
Правила выхода
- Выход из длинной позиции, когда зеленая гистограмма пересекает линию взрыва сверху вниз
- Выход из короткой позиции, когда красная гистограмма пересекает линию взрыва сверху вниз
Ключевое понимание Угол наклона линии взрыва имеет значение. Когда линия взрыва направлена вверх, а гистограмма пробивает ее сверху, это подтверждает, что волатильность активно растет — "взрыв" реальный, а не ложный сигнал.
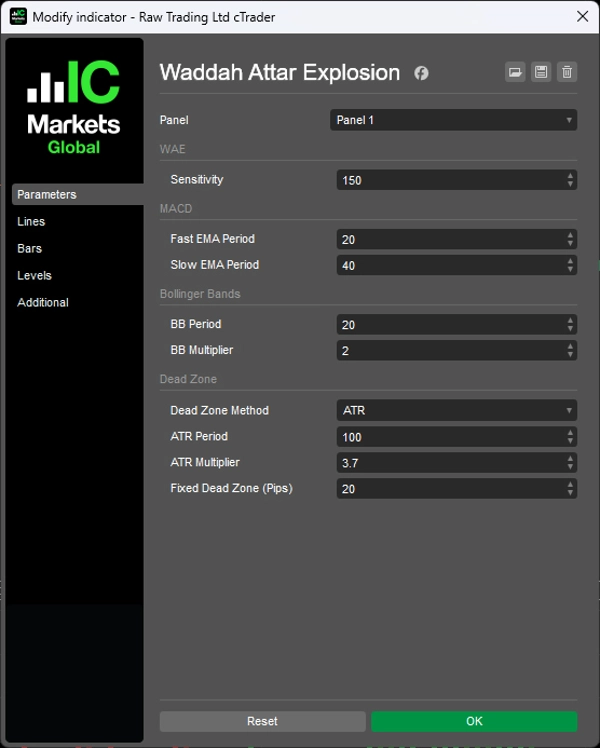
ПАРАМЕТРЫ
1. Чувствительность
- Чувствительность (150): Множитель для скорости изменения MACD
2. MACD
- Период быстрой EMA (20): Быстрая скользящая средняя для расчета MACD
- Период медленной EMA (40): Медленная скользящая средняя для расчета MACD
3. Полосы Боллинджера
- Период BB (20): Период обратного просмотра полос Боллинджера
- Множитель BB (2.0): Множитель стандартного отклонения
4. Мертвая зона
- Метод мертвой зоны (ATR): Выбор между основанным на ATR или фиксированным значением в пипсах
- Период ATR (100): Период для расчета ATR
- Множитель ATR (3.7): Множитель, применяемый к ATR для мертвой зоны
- Фиксированная мертвая зона (20): Значение мертвой зоны в пипсах (при использовании фиксированного метода)
ПРИМЕЧАНИЯ
- Индикатор работает на всех таймфреймах. Оригинальный автор рекомендовал H1 и M30.
- Рекомендуется использовать мертвую зону на основе ATR, так как она адаптируется к различным инструментам и рыночным условиям.
- Параметр чувствительности может потребовать настройки в зависимости от таймфрейма и волатильности инструмента.
- Этот индикатор выявляет совпадение импульса и волатильности — он не предсказывает направление самостоятельно. Рассмотрите возможность использования его вместе с анализом тренда или уровнями поддержки/сопротивления.
__________________________________________________________________________________________
БОЛЬШЕ БЕСПЛАТНЫХ ИНДИКАТОРОВ
Изучите широкий спектр инструментов анализа рынка — от структуры и объема до регрессии, волатильности и пользовательских таймфреймов.
Исходный код доступен на GitHub репозитории.
Все бесплатно для использования. Но если хотите поддержать автора кофе, можете сделать это здесь.
Поддержка/Сопротивление
- Разрыв справедливой стоимости
- Разрыв справедливой стоимости (расширенный)
- Пивотные точки
- Круглое число
Объем
- Профайлер активности объема
- Анализатор эффективности объема
- Аналитика профиля объема
- Профиль объема - обновленный
- Анализ распределения объема
- VWAP (средневзвешенная цена по объему)
Скользящие средние
- SSL канал
- Закрепленная скользящая средняя
- Скользящая средняя с масштабированием отклонения
- Активатор Ганна High Low
- Мгновенная трендовая линия
- Адаптивная скользящая средняя Кауфмана с Trend Vision
- Канал скользящих средних
- Набор скользящих средних
- Трендовый канал скользящих средних
Утилиты/Пользовательские
На основе регрессии
Волатильность
Осцилляторы
__________________________________________________________________________________________
ОТКАЗ ОТ ОТВЕТСТВЕННОСТИ
Торговля связана с риском. Этот индикатор предназначен только для технического анализа — всегда применяйте надлежащее управление рисками и торгуйте ответственно.
ОБРАТНАЯ СВЯЗЬ И УЛУЧШЕНИЯ
Если у вас есть предложения, запросы функций или идеи для улучшения, пожалуйста, оставьте комментарий во вкладке Обсуждение. Ваш отзыв помогает улучшить индикатор для всех.