설명
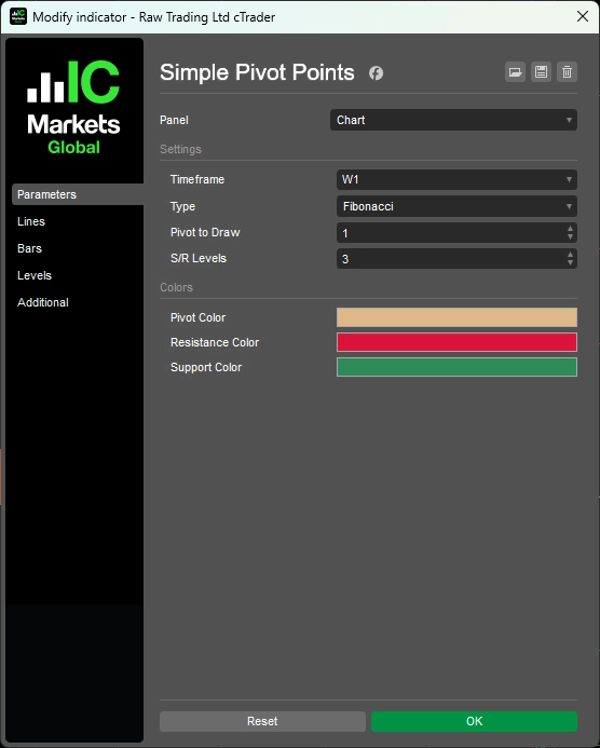
모든 타임프레임에서 다섯 가지 전문 피벗 방법을 사용하여 지지선 및 저항선 수준을 계산하세요.
M5부터 월간 데이터까지 각 기간에 대해 시간 제한 표시와 함께 피벗 수준(표준, 피보나치, 우디, 카마릴라, 드마크)을 자동으로 생성합니다.
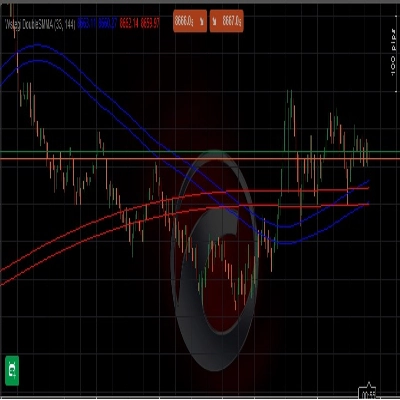
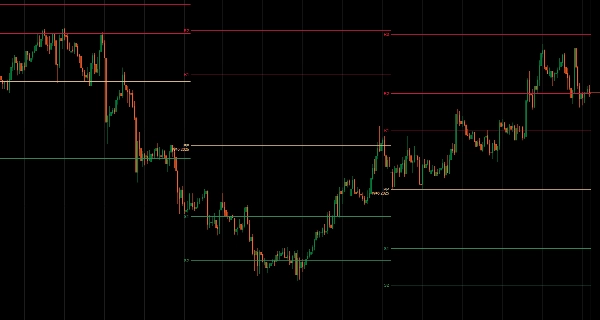
서로 다른 S/R 간격 논리를 가진 다섯 가지 계산 알고리즘, 구성 가능한 지지/저항 수준(각 측면당 0-6개), 여러 이전 기간의 과거 피벗 표시, 자동 라벨링된 선(PP, R1-R6, S1-S6), 색상 구분 시각화는 주요 가격 수준과 일중 반전을 목표로 하는 트레이더에게 기관급 피벗 분석을 제공합니다.
특징
다섯 가지 계산 방법
- 표준: 고전적인 플로어 트레이더 공식—전 세계에서 가장 널리 관찰되는 피벗
- 피보나치: S/R 간격에 피보 비율(38.2%, 61.8%, 100%, 138.2%, 161.8%) 사용
- 우디: 종가에 무게를 많이 둠—최근 가격 움직임에 더 민감함
- 카마릴라: 1.1/12 배수를 사용한 촘촘한 일중 수준—스캘핑에 인기
- 드마크: 종가와 시가 관계에 따른 조건부 공식—S/R 수준은 1개뿐이지만 매우 존중받음
완전한 사용자 정의
- 모든 타임프레임: M5, H1, H4, 일간, 주간, 월간 데이터에서 계산
- 과거 피벗: 여러 이전 기간(예: 최근 3주간 피벗)까지 표시
- 구성 가능한 수준: 각 측면당 0-6개의 지지/저항 수준 표시
- 자동 라벨링된 선: PP, R1-R6, S1-S6 명확하게 표시
- 시간 제한 선: 각 기간의 피벗은 해당 기간 동안에만 표시
- 색상 구분: 피벗(황갈색), 저항(빨강), 지지(녹색)
__________________________________________________________________________________________
더 많은 무료 지표
구조 및 거래량부터 회귀, 변동성, 맞춤 타임프레임에 이르기까지 다양한 시장 분석 도구를 탐색하세요.
소스 코드는 GitHub 저장소에서 확인할 수 있습니다.
모두 무료로 사용할 수 있습니다. 하지만 커피 지원을 보내고 싶다면 여기로 보내실 수 있습니다.
지지/저항
거래량
이동 평균
유틸리티/커스텀
회귀 기반
변동성
오실레이터
__________________________________________________________________________________________
면책 조항
거래에는 위험이 따릅니다. 이 지표는 기술적 분석용으로만 의도되었으며 항상 적절한 위험 관리를 적용하고 책임감 있게 거래하세요.
피드백 및 개선 사항
제안, 기능 요청 또는 개선 아이디어가 있으면 토론 탭에 댓글을 남겨주세요. 여러분의 피드백은 모두를 위한 지표 개선에 도움이 됩니다.
요약
고객 리뷰
5 | 100 % | |
4 | 0 % | |
3 | 0 % | |
2 | 0 % | |
1 | 0 % |