present
가입하고 첫 구매 시 $50 할인을 받으세요
Trading product for Repiptor RSI Amplified 지표 RSI, image 1
Repiptor RSI Amplified
지표
339 다운로드
버전 1.0, Oct 2024
Windows, Mac
5.0
리뷰: 1
Trading product for Repiptor RSI Amplified 지표 RSI, image 2
Trading product for Repiptor RSI Amplified 지표 RSI, image 3
가입일 26/10/2024
1.26K
무료 설치

설명

신호를 더 명확하게 만드는 증폭된 RSI.

요약

AI summary
Repiptor RSI Amplified is a technical indicator designed to enhance the traditional Relative Strength Index (RSI) by amplifying its signals. This amplification aims to make the RSI signals clearer and more distinct, potentially aiding traders in better identifying momentum changes in various markets. The indicator focuses on improving the interpretability of RSI data without altering its fundamental calculation method. It is categorized under momentum indicators and is suitable for traders who use RSI as part of their technical analysis toolkit.
지표 프로필

고객 리뷰

5.0
리뷰: 1
5
100 %
4
0 %
3
0 %
2
0 %
1
0 %
고객 리뷰
August 12, 2025
Pros: Enhanced RSI sensitivity, customizable, stable performance. Cons: No alerts, no MTF, fixed overbought/oversold levels.

상담

자주 묻는 질문(FAQ)

RSI
트레이딩 봇, 지표, 플러그인 등 cTrader Store에서 제공되는 상품은 제3자 개발자에 의해 제공되며, 이는 단순히 정보 및 기술적 접근을 목적으로 제공된 것입니다. cTrader Store는 중개인이 아니며, 투자 조언, 개인별 추천 또는 향후 성과에 대한 어떠한 보장도 제공하지 않습니다.

이 작성자의 상품 더 보기

지표
Candlestick pattern detector lite version
지표
Bollinger
Colored Bollinger Bands Width
지표
Bollinger
Bollinger Bands Width

좋아하실 만한 다른 항목

지표
ATR
BOS
+5
Opening ranges, dynamic trend channels, and multi-scale breakout/retest analysis for clear intraday chart decisions.
지표
Custom Vwap Indicator
지표
Prop
Forex
+11
Market Structure Shift – Professional Market Structure Oscillator
지표
RSI
MACD
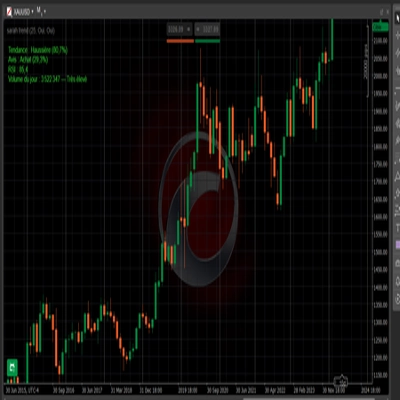
Un indicateur tout-en-un intelligent qui détecte la tendance, donne un avis clair (achat/vente)
지표
Aggressive
Supertrend
+5
Stop trading with tunnel vision! 🚫 The Heat Map Dashboard is an institutional-grade visual trading assistant
지표
Volume
Key Levels
View tick activity across a selected chart range with Point of Control, Value Area High and Value Area Low.
지표
RSI
MACD
+7
The ZigZag indicator is a technical analysis tool primarily used to identify key price reversal points.
지표
MSS
Volume
+3
Rejection-based volume profile with tiered heat zones, POC levels and a fully draggable anchor on cTrader.
지표
AI
ATR
+27
The "Market Temperature" Moving Average -Turn Your MA Into a Live Market Temperature Line
지표
AI-assisted
Order Block
+5
The daily bias estimator indicator uses ICT concepts to show whether the chart is bullish or bearish on multi-time frame
지표
ATR
RSI
+4
Adaptive Ichimoku with nine-factor confluence scoring, five signal types, smart TP/SL and an MTF panel.
지표
Forex
Crypto
+2
Unique Pyramid Design , Clear Price Action Trend
지표
EMA
RSI
+4
🚀📈 Plot buy/sell signals on Range Bars using Moving Averages and RSI. Clear, actionable trading insights.🚀📈
지표
ATR
RSI
+5
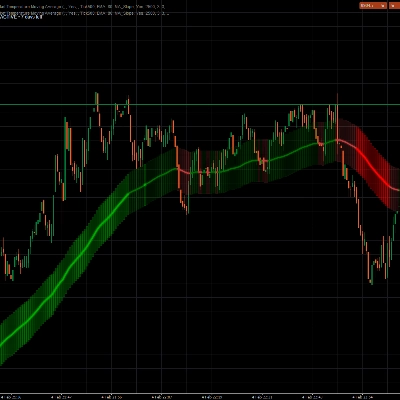
Fusion trend line with a layered cloud, BULL and BEAR labels, scored re-entry triangles and exit markers.
지표
ATR
RSI
+5
One of the best indicators we have ever developed, with a very high profit ratio.
지표
ATR
Key Levels
+3
Automated session boxes, live ADR volatility meter & institutional key levels with glassmorphic HUD.
지표
RSI
Forex
+6
What Constance Brown did with the RSI was to input a momentum calculation within the RSI itself. This the Composite RSI.
지표
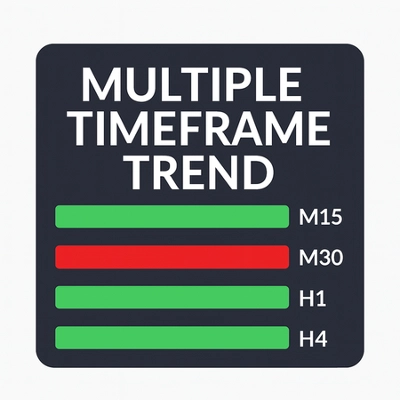
A compact, visual multi-timeframe trend indicator for cTrader. Easily spot bullish or bearish trends across 4 customizab

가격

가입일 26/10/2024
1.26K
무료 설치