
설명
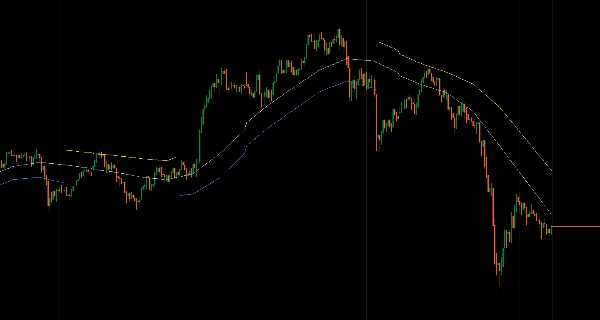
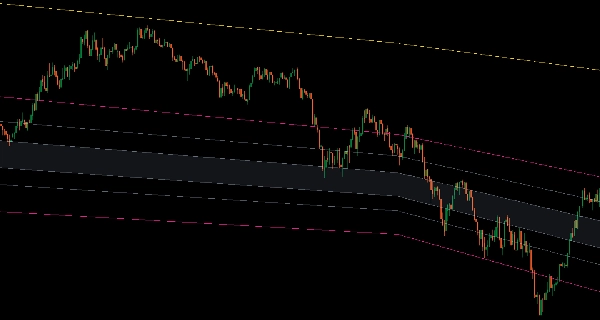
추세 방향 및 구조 분석을 위한 네 가지 OHLC 가격 모두에 이동 평균을 사용하는 삼색 적응 채널 시스템.
고가/저가 경계, 시가/종가 방향성 편향선, 그리고 색상으로 구분된 추세 상태(파란색 상승 추세, 금색 하락 추세, 회색 중립)를 함께 적응하여 표시합니다.
두 가지 표시 모드(전체 채널 또는 추세 기반 혼잡 감소), 여섯 가지 선택적 피보나치 영역(전체 채널 되돌림, 반채널 수준, 돌파 확장), 15가지 이동 평균 알고리즘(Arnaud Legoux, Jurik, Hull, KAMA, VIDYA, 편차 스케일, SuperSmoother, Ultimate Smoother, McGinley Dynamic, T3, ZLEMA, Laguerre), 다중 시간 프레임 보간, 이벤트 기반 성장 기간을 위한 앵커 날짜 계산, 그리고 추세 기반 바 색상 지정은 정의된 경계 내에서 되돌림과 평균 회귀를 목표로 하는 트레이더에게 일관된 채널 구조를 제공합니다.
특징
삼색 추세 시스템
- 파란색 선: 상승 추세 확인—저선으로 되돌림 거래
- 금색 선: 하락 추세 확인—고선으로 반등 거래
- 회색 선: 중립/횡보—극단을 피하고 중간을 스캘핑
- 모든 선이 함께 적응—혼합 신호 없음
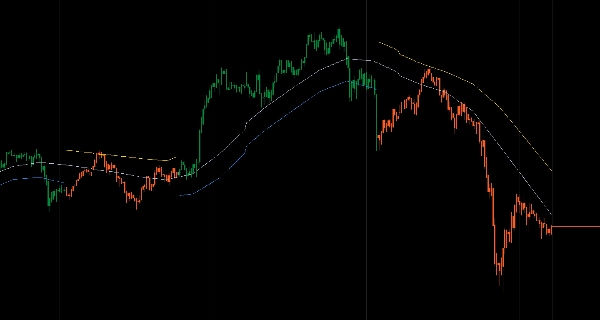
완전한 채널 구조
- 고가/저가 선이 채널 경계를 정의
- 시가/종가 선이 채널 내 방향성 편향을 표시
- 중간선(네 가지 모두의 중심)이 진정한 균형을 표시
- 일관되게 움직이는 통합 구조
두 가지 표시 모드
- 채널 모드: 항상 추세 색상과 함께 두 경계 모두 표시
- 추세 기반 모드: 상승 추세에서는 고선 숨기기, 하락 추세에서는 저선 숨기기—시각적 혼잡 감소, 거래 가능한 경계에 집중 유지
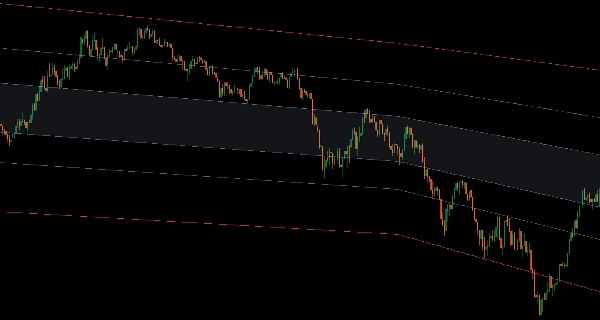
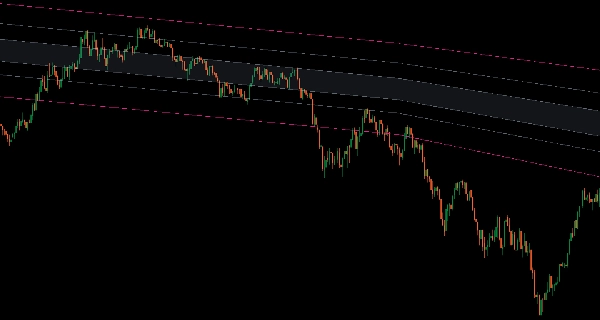
6개의 피보나치 영역 (선택 사항)
- 저가-고가 사이 (전체 채널 되돌림)
- 저가-중간 또는 중간-고가 사이 (반채널 수준)
- 상단/하단 확장 (돌파 목표)
- 전체 범위 (하단부터 상단 확장까지)
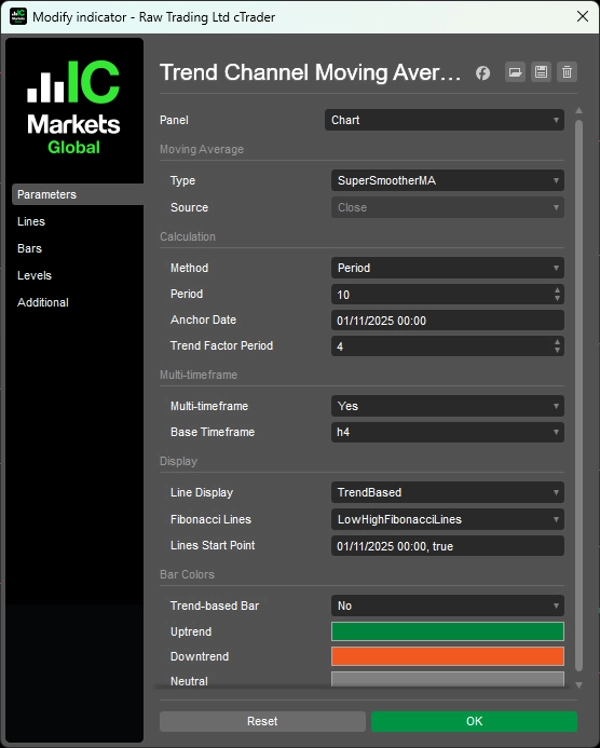
15가지 이동 평균 유형
- 전문 알고리즘: Arnaud Legoux, Jurik, Hull, KAMA, VIDYA, 편차 스케일, SuperSmoother, Ultimate Smoother, McGinley Dynamic, T3, ZLEMA, Laguerre
- 추세 식별에 최적화된 깨끗한 신호
고급 기능
- 부드러운 보간을 지원하는 다중 시간 프레임 모드
- 앵커 날짜 계산 (특정 이벤트/레벨에서 시작하는 성장 기간)
- 추세 기반 바 색상 지정 (선택 사항)
- 선 시작점 제어 (과거 데이터 숨기기, 최근 구조만 표시)
__________________________________________________________________________________________
더 많은 무료 지표
구조와 거래량부터 회귀, 변동성, 맞춤 시간 프레임에 이르기까지 다양한 시장 분석 도구를 탐색해 보세요.
소스 코드는 GitHub 저장소에서 확인할 수 있습니다.
모두 무료로 사용할 수 있습니다. 하지만 커피 지원을 보내고 싶다면 여기로 보내실 수 있습니다.
지지/저항
거래량
이동 평균
- SSL 채널
- 앵커 이동 평균
- 편차 스케일 이동 평균
- 간 하이 로우 액티베이터
- 순간 추세선
- 트렌드 비전이 포함된 카우프만 적응 MA
- 이동 평균 채널
- 이동 평균 스위트
- 추세 채널 이동 평균
유틸리티/커스텀
회귀 기반
변동성
오실레이터
__________________________________________________________________________________________
면책 조항
거래에는 위험이 따릅니다. 이 지표는 기술적 분석용으로만 의도되었으며 항상 적절한 위험 관리와 책임 있는 거래를 적용하십시오.
피드백 및 개선 사항
제안, 기능 요청 또는 개선 아이디어가 있으면 토론 탭에 댓글을 남겨주세요. 여러분의 피드백은 모든 사용자를 위한 지표 개선에 도움이 됩니다.
요약
Key features include two display modes—full channel and trend-based clutter reduction—and six optional Fibonacci zones covering full and half-channel retracements plus breakout extensions. The system supports 15 professional moving average algorithms such as Arnaud Legoux, Jurik, Hull, KAMA, VIDYA, and others, optimized for clean trend identification. Additional functionalities include multi-timeframe interpolation, anchor date calculation for event-based periods, trend-based bar coloring, and control over line start points to focus on recent data.
This indicator is designed to help traders identify pullbacks and mean reversion opportunities within defined channel boundaries, enhancing decision-making in various market conditions.
고객 리뷰
5 | 100 % | |
4 | 0 % | |
3 | 0 % | |
2 | 0 % | |
1 | 0 % |


