
Descripción
VISIÓN GENERAL
Fundamento: Principios de Wyckoff
Este indicador se basa en dos conceptos complementarios de la metodología Wyckoff:
1. Esfuerzo vs Resultado
El principio central de Wyckoff establece que el movimiento del precio (resultado) debe ser proporcional al volumen que lo respalda (esfuerzo). Cuando el esfuerzo y el resultado están en armonía, el mercado se comporta normalmente. Cuando divergen, señala posibles puntos de inflexión o fuerza de continuación.
Este indicador implementa directamente esto a través de la Eficiencia (resultado por unidad de esfuerzo) y su inverso, Absorción (esfuerzo que no se traduce en resultado).
2. Análisis del Spread
Wyckoff también enfatizó el análisis del carácter de las barras de precio individuales—examinando el spread (rango), dónde cerró el precio dentro de ese rango y si la barra mostró compromiso o indecisión.
Este indicador implementa el análisis del spread a través de Convicción (compromiso direccional), Ratio Desperdiciado (retroceso dentro de la barra), y Posición de Cierre (usada para contextualizar la absorción como acumulación o distribución).
LO QUE HACE ESTE INDICADOR
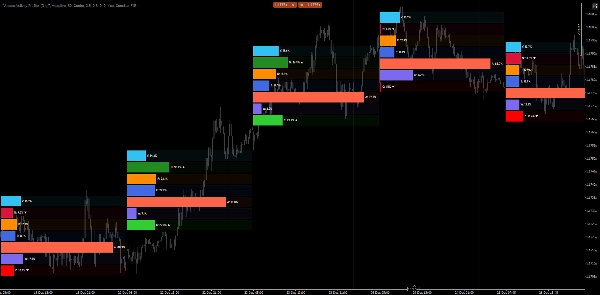
Volume Activity Profiler analiza las barras de precio de un marco temporal seleccionado y descompone su actividad en componentes medibles. Calcula tanto métricas brutas como métricas derivadas basadas en percentiles, luego las muestra como gráficos de barras horizontales anclados debajo de cada barra analizada.
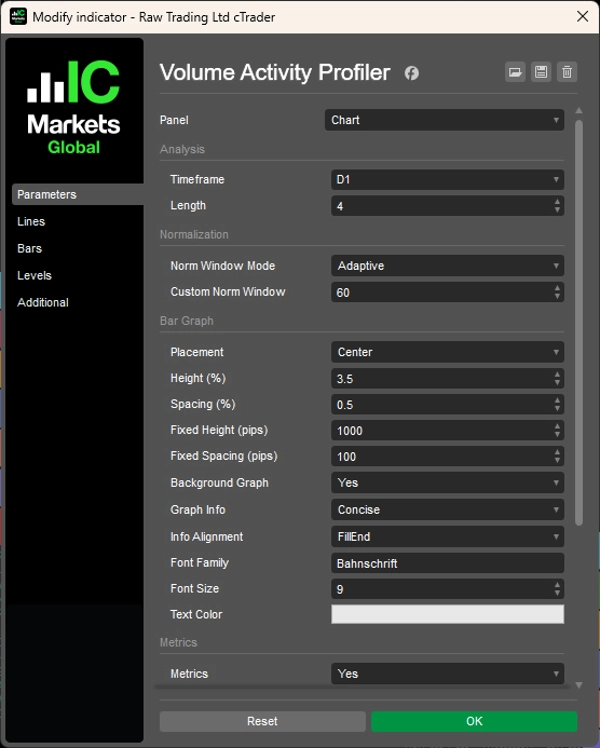
Configuras dos parámetros principales:
- Marco temporal: El marco temporal a analizar (por ejemplo, Semanal, Diario, H4)
- Longitud: Cuántas barras perfilar (por ejemplo, últimas 4 barras)
Luego, el indicador perfila cada barra dentro de ese alcance, calculando métricas y clasificándolas entre sí y contra normas históricas.
MÉTRICAS EXPLICADAS
Métricas brutas (proporcionales entre barras perfiladas):
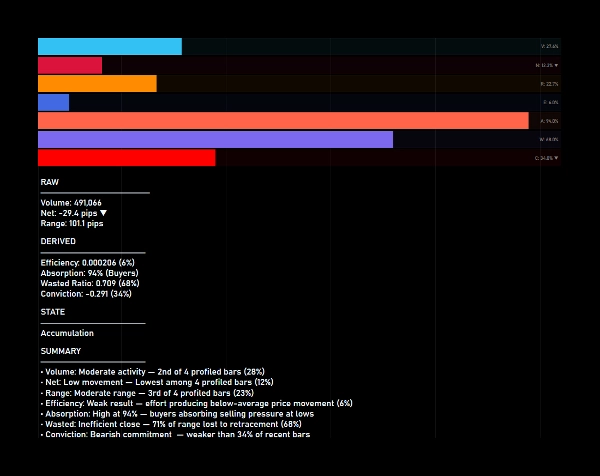
1. Volumen
Volumen de ticks de la barra. Muestra qué proporción del volumen total perfilado representa esta barra.
2. Neto
Movimiento direccional (cierre − apertura) en pips. Muestra la proporción del movimiento neto total. El color indica dirección (verde = alcista, rojo = bajista).
3. Rango
Rango total de precio (alto − bajo) en pips. Muestra la proporción del rango total entre las barras perfiladas.
Métricas derivadas (basadas en percentiles contra ventana histórica):
1. Eficiencia (Esfuerzo vs Resultado)
Rango producido por unidad de volumen. Alta eficiencia significa que el esfuerzo se traduce en movimiento de precio. Baja eficiencia sugiere absorción o resistencia.
2. Absorción (Esfuerzo vs Resultado)
Inverso de la eficiencia. Alta absorción indica que el volumen está siendo absorbido sin movimiento proporcional del precio—potencial acumulación o distribución.
3. Desperdicio (Análisis del Spread)
Porcentaje del rango perdido por retroceso (rango − neto) / rango. Alto desperdicio significa que la barra devolvió gran parte de su movimiento. Bajo desperdicio indica una barra limpia y direccional.
4. Convicción (Análisis del Spread)
Compromiso direccional medido como neto/rango. Alta convicción significa que la barra cerró cerca de su extremo. Baja convicción indica indecisión o rechazo.
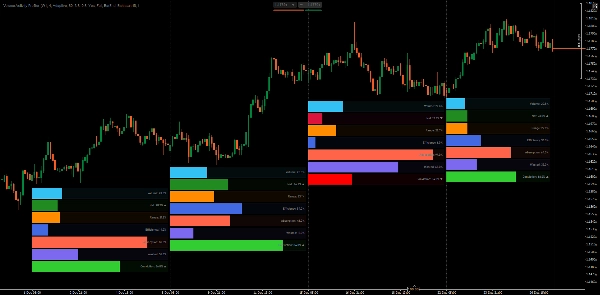
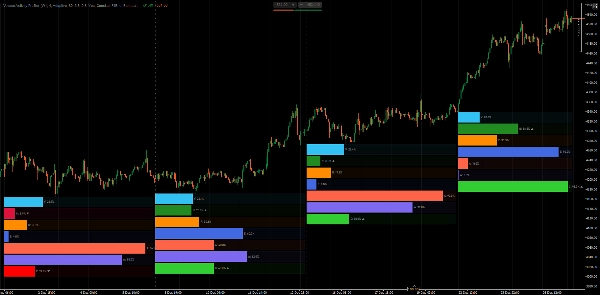
ENTENDIENDO LOS GRÁFICOS DE BARRAS
Cada barra perfilada muestra 7 barras horizontales:
- Volumen, Neto, Rango — Rellenadas según la proporción entre barras perfiladas
- Eficiencia, Absorción, Desperdicio, Convicción — Rellenadas según el rango percentil contra datos históricos
Una barra rellena al 80% en Eficiencia significa que la eficiencia de esta barra es mayor que el 80% de las barras en la ventana de normalización.
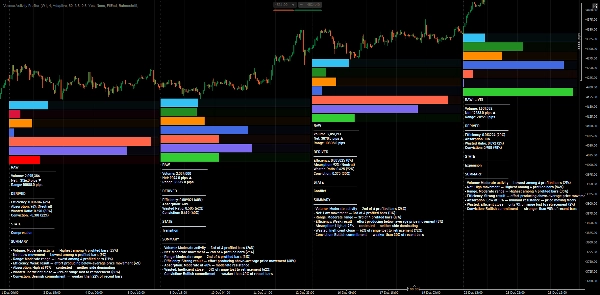
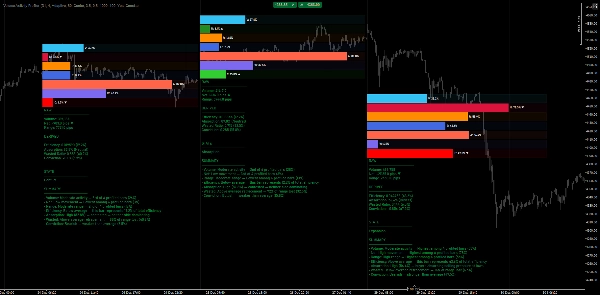
CLASIFICACIÓN DEL ESTADO DE ACTIVIDAD
Cuando la visualización de Métricas está habilitada, el indicador clasifica cada barra en uno de estos estados:
1. Compresión
Baja eficiencia + baja convicción — el precio se está enrollando, acumulando energía potencial
2. Expansión
Alta eficiencia + alta convicción + bajo desperdicio — movimiento direccional fuerte
3. Conflicto
Alto desperdicio + baja convicción — batalla entre compradores y vendedores
4. Acumulación
Alta absorción + cierre cerca de mínimos — compradores absorbiendo presión de venta
5. Distribución
Alta absorción + cierre cerca de máximos — vendedores absorbiendo presión de compra
6. Rechazo
Alta convicción pero cierre opuesto a la dirección — movimiento fallido, posible reversión
7. Transición
Señales mixtas — mercado en transición entre estados
BENEFICIOS PRÁCTICOS
- Evaluación rápida de esfuerzo vs resultado — Ver instantáneamente si el volumen está produciendo un movimiento proporcional o está siendo absorbido.
- Análisis de estructura multi-marco temporal — Analiza barras de marcos temporales superiores mientras permaneces en tu marco temporal de ejecución.
- Identificar acumulación/distribución — Alta absorción con posicionamiento de cierre revela dónde pueden estar activos grandes jugadores.
- Detectar agotamiento y rechazo — Alta convicción con posición de cierre opuesta advierte de posibles reversiones.
- Comparar barras objetivamente — Clasificaciones y percentiles eliminan la subjetividad en evaluaciones de volumen "alto" o "bajo".
- Confirmar rupturas — Estado de expansión con alta eficiencia y convicción confirma interés genuino en la ruptura.
VOLUMEN DE TICKS COMO PROXY DE ESFUERZO
Este indicador usa el volumen de ticks como su entrada de esfuerzo. En forex, el volumen de ticks representa la frecuencia de cambio de precio más que el volumen real negociado—una limitación conocida de los mercados descentralizados.
A pesar de esto, el volumen de ticks sirve efectivamente como proxy de esfuerzo porque:
- Refleja la actividad relativa del mercado entre barras
- Altos conteos de ticks indican mayor participación de los participantes
- La relación esfuerzo vs resultado se mantiene—alta actividad que produce poco movimiento aún señala absorción
Las clasificaciones percentiles y comparaciones de barras del indicador permanecen válidas mientras los datos sean consistentes.
NOTAS
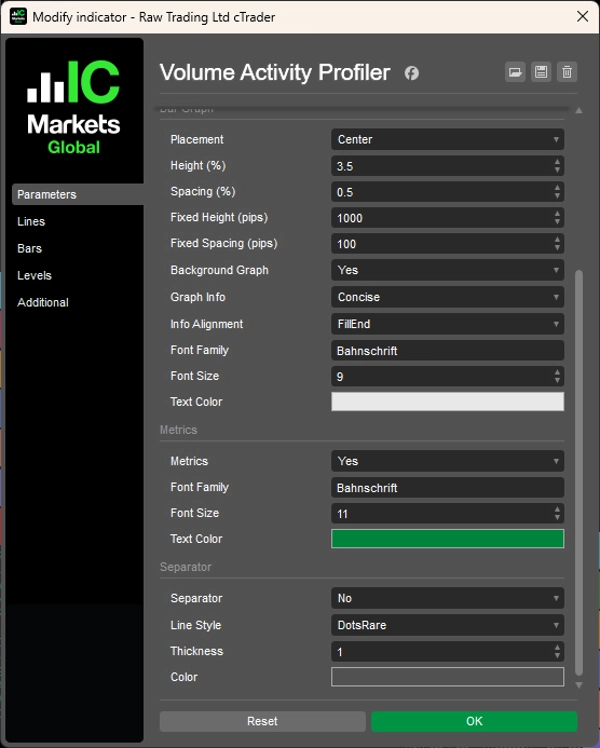
- El indicador usa ventanas de normalización adaptativas basadas en el marco temporal cuando está configurado en modo Adaptativo, asegurando contexto histórico relevante.
- Los cálculos percentiles se actualizan solo en barras completadas para evitar lecturas inestables en barras en formación.
- La barra actual en formación está marcada con [LIVE] en el panel de métricas.
__________________________________________________________________________________________
MÁS INDICADORES GRATUITOS
Explora una amplia gama de herramientas de análisis de mercado—desde estructura y volumen hasta regresión, volatilidad y marcos temporales personalizados.
El código fuente está disponible en el repositorio de GitHub repository.
Todos son gratuitos para usar. Pero si deseas apoyar con un café, puedes hacerlo aquí.
Soporte/Resistencia
Volumen
- Volume Activity Profiler
- Volume Efficiency Analyzer
- Volume Profile Analytics
- Volume Profile - Updated
- Volume Spread Analysis
- VWAP (Precio Promedio Ponderado por Volumen)
Medias Móviles
- Canal SSL
- Media Móvil Anclada
- Media Móvil Escalada por Desviación
- Activador Gann High Low
- Línea de Tendencia Instantánea
- Media Móvil Adaptativa Kaufman con Visión de Tendencia
- Canal de Media Móvil
- Suite de Medias Móviles
- Media Móvil de Canal de Tendencia
Utilidades/Personalizados
Basado en Regresión
Volatilidad
Osciladores
__________________________________________________________________________________________
DESCARGO DE RESPONSABILIDAD
El trading implica riesgos. Este indicador está destinado solo para análisis técnico — siempre aplica una gestión de riesgos adecuada y opera responsablemente.
RETROALIMENTACIÓN Y MEJORAS
Si tienes sugerencias, solicitudes de funciones o ideas para mejoras, por favor deja un comentario en la pestaña de Discusión. Tu retroalimentación ayuda a mejorar el indicador para todos.
Resumen
The indicator profiles price bars over a user-selected timeframe and length, calculating raw metrics such as Volume (tick volume proportion), Net (directional price movement), and Range (price range). It also derives percentile-based metrics including Efficiency (price movement per volume unit), Absorption (volume without proportional price change), Wasted Ratio (retracement within the bar), and Conviction (directional commitment).
These metrics are visually represented as horizontal bar graphs beneath each analyzed bar, facilitating objective comparison and historical context. The indicator classifies bars into activity states like Compression, Expansion, Conflict, Accumulation, Distribution, Rejection, and Transition, aiding in identifying market phases and potential turning points.
Volume Activity Profiler uses tick volume as an effort proxy, reflecting relative market activity. It supports multi-timeframe analysis and updates percentile rankings on completed bars to ensure stable readings. This tool assists traders in assessing volume efficiency, spotting accumulation/distribution, confirming breakouts, and understanding market structure through quantitative volume and price bar analysis.
Valoraciones de clientes
5 | 100 % | |
4 | 0 % | |
3 | 0 % | |
2 | 0 % | |
1 | 0 % |


