
Opis
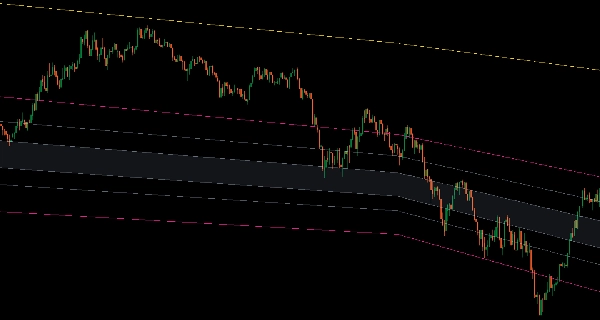
Trójkolorowy adaptacyjny system kanałowy wykorzystujący średnie kroczące na wszystkich czterech cenach OHLC do analizy kierunku trendu i struktury.
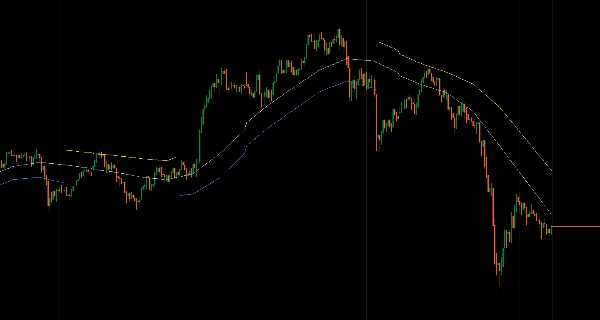
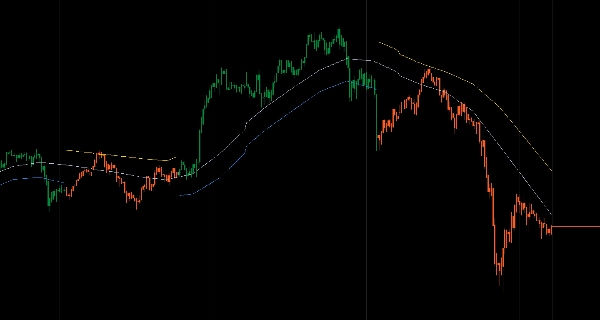
Wyświetla granice High/Low, linie biasu kierunkowego Open/Close oraz medianę równowagi z kolorowymi stanami trendu (niebieski trend wzrostowy, złoty trend spadkowy, szary neutralny), które dostosowują się razem.
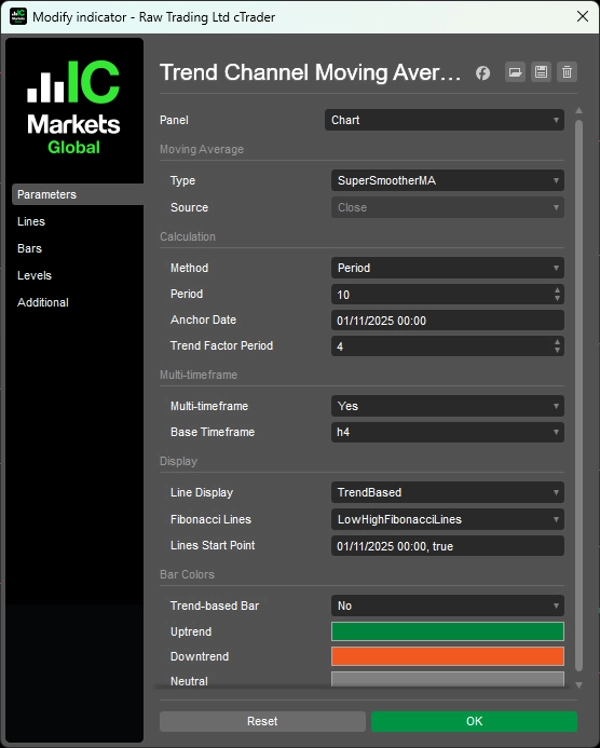
Dwa tryby wyświetlania (pełny kanał lub redukcja zagracenia oparta na trendzie), sześć opcjonalnych stref Fibonacciego (pełne cofnięcia kanału, poziomy półkanału, rozszerzenia wybicia), 15 algorytmów średnich kroczących (Arnaud Legoux, Jurik, Hull, KAMA, VIDYA, Deviation Scaled, SuperSmoother, Ultimate Smoother, McGinley Dynamic, T3, ZLEMA, Laguerre), interpolacja wieloczasowa, obliczanie daty kotwicy dla okresów rosnących opartych na zdarzeniach oraz kolorowanie słupków oparte na trendzie zapewniają spójną strukturę kanału dla traderów celujących w cofnięcia i powrót do średniej w określonych granicach.
CECHY
Trójkolorowy System Trendu
- Niebieskie linie: Potwierdzony trend wzrostowy — handluj cofnięcia do dolnej linii
- Złote linie: Potwierdzony trend spadkowy — handluj odbicia do górnej linii
- Szare linie: Neutralny/zakresowy — ignoruj skrajności, skalpuj środek
- Wszystkie linie dostosowują się razem — brak mieszanych sygnałów
Kompletna Struktura Kanału
- Linie High/Low definiują granice kanału
- Linie Open/Close pokazują bias kierunkowy w kanale
- Linia mediany (środek wszystkich czterech) oznacza prawdziwą równowagę
- Zintegrowana struktura poruszająca się spójnie
Dwa Tryby Wyświetlania
- Tryb Kanału: Zawsze pokazuj obie granice z kolorami trendu
- Tryb oparty na trendzie: Ukryj górną linię w trendach wzrostowych, dolną w trendach spadkowych — zmniejsza wizualne zagracenie, skupia uwagę na handlowej granicy
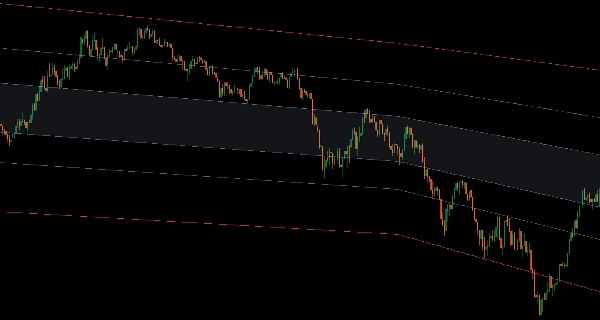
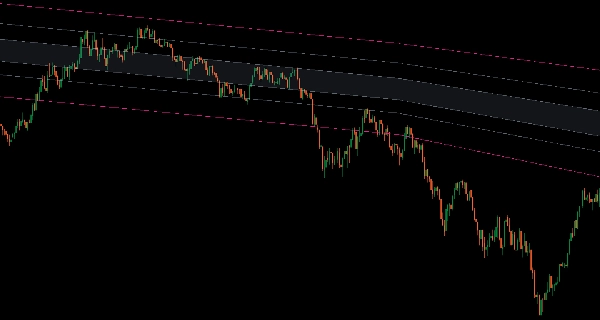
6 Stref Fibonacciego (Opcjonalne)
- Pomiędzy Low-High (pełne cofnięcia kanału)
- Pomiędzy Low-Median lub Median-High (poziomy półkanału)
- Górne/dolne rozszerzenia (cele wybicia)
- Cały zakres (od dolnego do górnego rozszerzenia)
15 Typów Średnich Kroczących
- Profesjonalne algorytmy: Arnaud Legoux, Jurik, Hull, KAMA, VIDYA, Deviation Scaled, SuperSmoother, Ultimate Smoother, McGinley Dynamic, T3, ZLEMA, Laguerre
- Czyste sygnały zoptymalizowane do identyfikacji trendu
Zaawansowana Funkcjonalność
- Tryb wieloczasowy z płynną interpolacją
- Obliczanie daty kotwicy (rosnący okres od konkretnego zdarzenia/poziomu)
- Kolorowanie słupków oparte na trendzie (opcjonalne)
- Kontrola punktu startowego linii (ukryj dane historyczne, pokaż tylko najnowszą strukturę)
__________________________________________________________________________________________
WIĘCEJ DARMOWYCH WSKAŹNIKÓW
Odkryj szeroki zakres narzędzi analizy rynku — od struktury i wolumenu po regresję, zmienność i niestandardowe ramy czasowe.
Kod źródłowy jest dostępny w repozytorium GitHub.
Wszystko dostępne za darmo. Ale jeśli chcesz wesprzeć kawą, możesz to zrobić tutaj.
Wsparcie/Oporność
Wolumen
- Volume Activity Profiler
- Volume Efficiency Analyzer
- Volume Profile Analytics
- Volume Profile - Updated
- Volume Spread Analysis
- VWAP (Volume Weighted Average Price)
Średnie Kroczące
- SSL Channel
- Anchored Moving Average
- Deviation-Scaled Moving Average
- Gann High Low Activator
- Instantaneous Trendline
- Kaufman Adaptive MA with Trend Vision
- Moving Average Channel
- Moving Averages Suite
- Trend Channel Moving Average
Narzędzia/Niestandardowe
Oparte na Regresji
Zmienność
Oscylatory
__________________________________________________________________________________________
ZASTRZEŻENIE
Trading wiąże się z ryzykiem. Ten wskaźnik jest przeznaczony wyłącznie do analizy technicznej — zawsze stosuj odpowiednie zarządzanie ryzykiem i handluj odpowiedzialnie.
OPINIE I ULEPSZENIA
Jeśli masz sugestie, prośby o funkcje lub pomysły na ulepszenia, prosimy o pozostawienie komentarza na karcie Dyskusja. Twoja opinia pomaga ulepszyć wskaźnik dla wszystkich.
Podsumowanie
Key features include two display modes—full channel and trend-based clutter reduction—and six optional Fibonacci zones covering full and half-channel retracements plus breakout extensions. The system supports 15 professional moving average algorithms such as Arnaud Legoux, Jurik, Hull, KAMA, VIDYA, and others, optimized for clean trend identification. Additional functionalities include multi-timeframe interpolation, anchor date calculation for event-based periods, trend-based bar coloring, and control over line start points to focus on recent data.
This indicator is designed to help traders identify pullbacks and mean reversion opportunities within defined channel boundaries, enhancing decision-making in various market conditions.
Opinie klientów
5 | 100 % | |
4 | 0 % | |
3 | 0 % | |
2 | 0 % | |
1 | 0 % |


