
الوصف
احسب مستويات الدعم والمقاومة باستخدام خمس طرق احترافية للمحاور عبر أي إطار زمني.
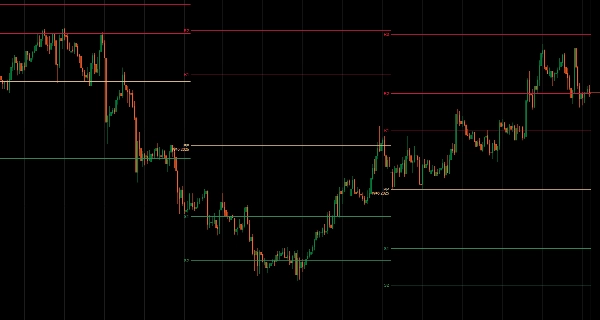
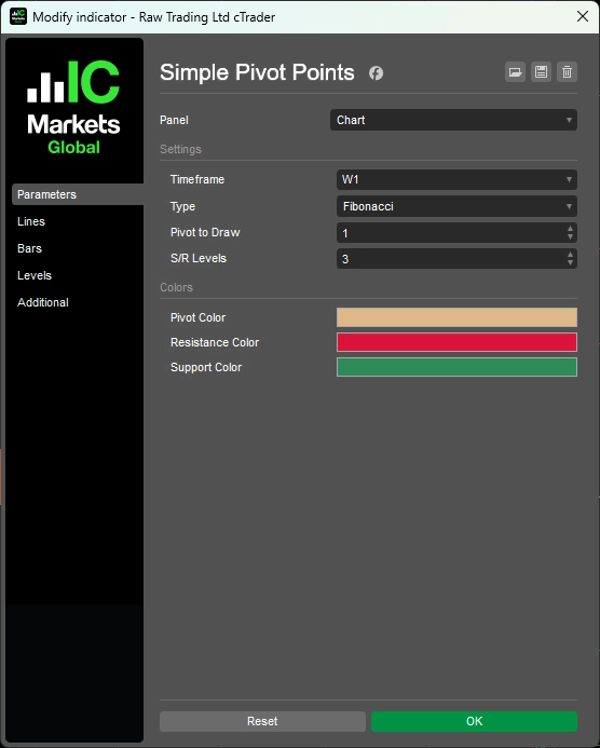
ينشئ تلقائيًا مستويات المحور (القياسية، فيبوناتشي، وودي، كاماريلا، دي مارك) من بيانات M5 إلى الشهرية مع عرض محدود بالزمن لكل فترة.
خمسة خوارزميات حسابية مع منطق تباعد S/R مميز، مستويات دعم/مقاومة قابلة للتكوين (0-6 لكل جانب)، عرض المحاور التاريخية لعدة فترات سابقة، خطوط معنونة تلقائيًا (PP، R1-R6، S1-S6)، وتصوير ملون يقدم تحليلاً للمحاور بمستوى مؤسسي للمتداولين الذين يستهدفون مستويات سعر رئيسية وانعكاسات داخل اليوم.
الميزات
خمس طرق حسابية
- قياسي: صيغة المتداول الكلاسيكية — أكثر المحاور متابعة عالميًا
- فيبوناتشي: يستخدم نسب فيبوناتشي (38.2٪، 61.8٪، 100٪، 138.2٪، 161.8٪) لتباعد الدعم/المقاومة
- وودي: يثقل سعر الإغلاق بشكل كبير — أكثر استجابة لحركة السعر الأخيرة
- كاماريلا: مستويات ضيقة داخل اليوم باستخدام مضاعفات 1.1/12 — شائعة للتداول السريع
- دي مارك: صيغة شرطية تعتمد على العلاقة بين الإغلاق والافتتاح — مستوى دعم/مقاومة واحد فقط لكنه محترم للغاية
تخصيص كامل
- أي إطار زمني: حساب من بيانات M5، H1، H4، يومي، أسبوعي، شهري
- محاور تاريخية: عرض لعدة فترات سابقة (مثلاً، آخر 3 أسابيع من المحاور)
- مستويات قابلة للتكوين: عرض 0-6 مستويات دعم/مقاومة لكل جانب
- خطوط معنونة تلقائيًا: PP، R1-R6، S1-S6 معلمة بوضوح
- خطوط محددة بالزمن: تعرض محاور كل فترة فقط لمدة تلك الفترة
- ملونة: المحور (بني فاتح)، المقاومة (أحمر)، الدعم (أخضر)
__________________________________________________________________________________________
مزيد من المؤشرات المجانية
استكشف مجموعة واسعة من أدوات تحليل السوق — من الهيكل والحجم إلى الانحدار، التقلب، والأطر الزمنية المخصصة.
رمز المصدر متاح على مستودع GitHub.
جميعها مجانية للاستخدام. ولكن إذا رغبت في تقديم دعم بالقهوة، يمكنك التبرع من هنا.
الدعم/المقاومة
الحجم
- محلل نشاط الحجم
- محلل كفاءة الحجم
- تحليلات ملف الحجم
- ملف الحجم - محدث
- تحليل انتشار الحجم
- VWAP (متوسط السعر المرجح بالحجم)
المتوسطات المتحركة
- قناة SSL
- المتوسط المتحرك المثبت
- المتوسط المتحرك بمقياس الانحراف
- مُفعّل جان العالي والمنخفض
- خط الاتجاه اللحظي
- متوسط متحرك تكيفي كوفمان مع رؤية الاتجاه
- قناة المتوسط المتحرك
- مجموعة المتوسطات المتحركة
- متوسط متحرك لقناة الاتجاه
الأدوات/المخصصة
مبني على الانحدار
التقلب
المذبذبات
__________________________________________________________________________________________
إخلاء المسؤولية
التداول ينطوي على مخاطر. هذا المؤشر مخصص للتحليل الفني فقط — دائماً طبق إدارة مخاطر مناسبة وتداول بمسؤولية.
التعليقات والتحسينات
إذا كانت لديك اقتراحات، طلبات ميزات، أو أفكار للتحسين، يرجى ترك تعليق في تبويب النقاش. تساعد ملاحظاتك في تحسين المؤشر للجميع.
الملخص
تقييمات العملاء
5 | 100 % | |
4 | 0 % | |
3 | 0 % | |
2 | 0 % | |
1 | 0 % |


