الوصف
نسخة محسنة مع التحكم في عتبة الملء الجزئي، تتبع دقيق للعمر، ومستويات فيبوناتشي تلقائية على الفجوات.
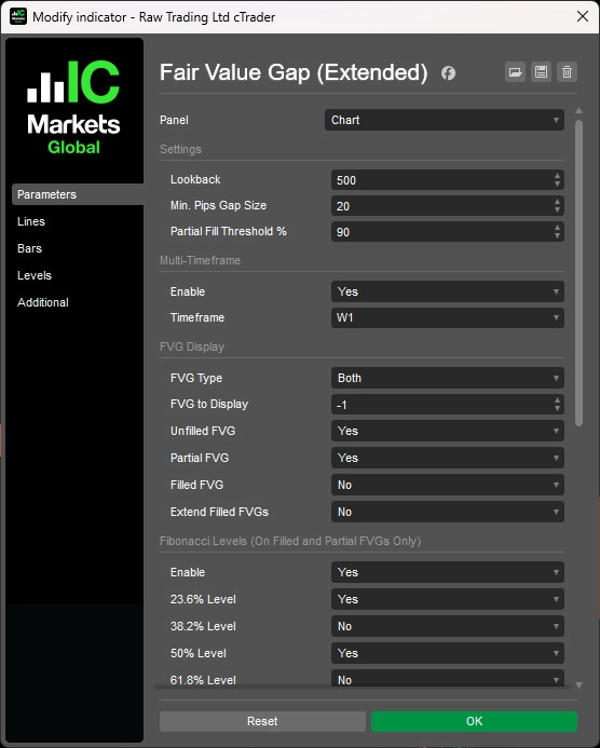
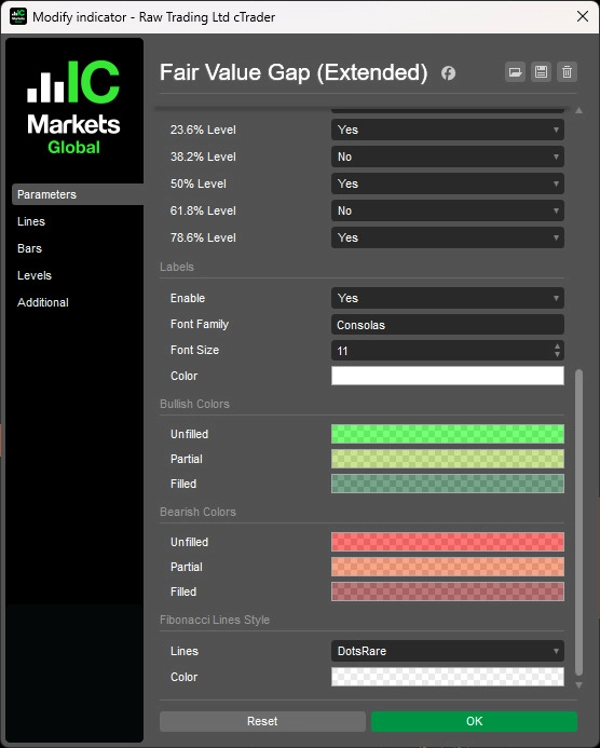
يكتشف تلقائيًا الفجوات الصاعدة والهابطة مع عتبة ملء جزئي قابلة للتكوين (50-99٪، الافتراضي 90٪)، يعرض عمر الفجوة بصيغة السنوات/الأشهر/الأسابيع/الأيام، ويتوقع خمسة مستويات فيبوناتشي (23.6٪ إلى 78.6٪) على فجوات القيمة العادلة الجزئية والمملوءة.
مسح متعدد الأطر الزمنية لمواءمة الفجوات الهيكلية في الإطار الزمني الأعلى مع حركة السعر في الإطار الزمني الأدنى، خيار لتمديد صناديق فجوات القيمة العادلة المملوءة إلى الشمعة الحالية، عرض غير محدود للفجوات التاريخية (-1 للإعداد)، تحديثات حالة ديناميكية (غير مملوءة/مملوءة جزئيًا/مملوءة بالكامل)، وتسميات بسيطة وغير متطفلة توفر تحليلًا شاملاً لاختلال التوازن في السيولة للمتداولين الذين يستهدفون ملء الفجوات مع مناطق دخول تعتمد على فيبوناتشي.
الميزات
تحسين تحديد فجوات القيمة العادلة
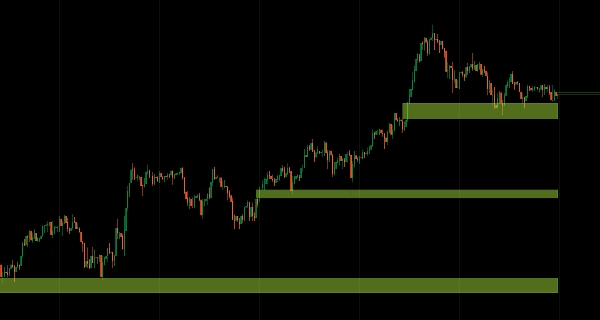
- يجد تلقائيًا فجوات القيمة العادلة الصاعدة والهابطة
- يتتبع حالة الفجوات غير المملوءة، المملوءة جزئيًا، والمملوءة بالكامل في الوقت الحقيقي
- عتبة الملء الجزئي: التحكم في متى يصبح الملء الجزئي ملء كامل (50-99٪، الافتراضي 90٪)
- رسم بصري نظيف مع أقل قدر من الفوضى على الرسم البياني
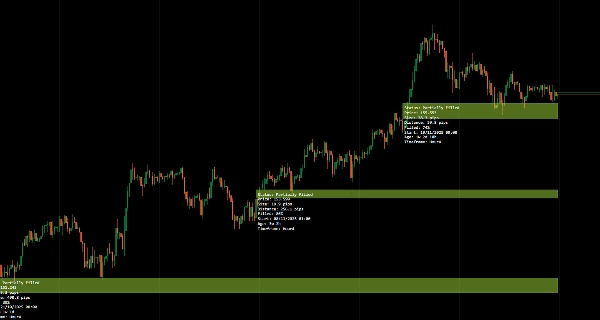
عرض العمر المحسن
- يعرض عمر الفجوة بدقة بالسنوات، الأشهر، الأسابيع، والأيام (مثلاً "3س 2أ 4ي")
- يساعد في إعطاء الأولوية للفجوات الجديدة مقابل القديمة لاختيار الصفقات
- سياق الوقت يحسن اتخاذ القرار بشأن صلة الفجوة
تتبع الحالة والعرض
- يعرض حالة الملء الحالية: غير مملوءة، مملوءة جزئيًا، أو مملوءة بالكامل
- يتم التحديث ديناميكيًا مع تفاعل السعر مع الفجوة
- تأكيد بصري على التقاط السيولة
- تمديد فجوات القيمة العادلة المملوءة: خيار لتمديد صناديق الفجوات المملوءة إلى الشمعة الحالية للرجوع إليها
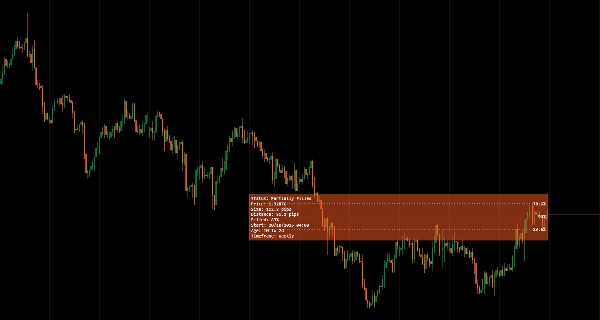
مستويات فيبوناتشي
- مستويات فيبوناتشي تلقائية (23.6٪، 38.2٪، 50٪، 61.8٪، 78.6٪) معروضة على فجوات القيمة العادلة الجزئية والمملوءة
- تلغي الحاجة لرسم المستويات يدويًا
- مناطق دخول دقيقة داخل الفجوات
- استراتيجيات دخول مبنية على فيبوناتشي مبسطة
وضع متعدد الأطر الزمنية
- مسح وعرض فجوات القيمة العادلة للإطار الزمني الأعلى على مخططات الإطار الزمني الأدنى
- مواءمة الفجوات الهيكلية للإطار الزمني الأعلى مع حركة السعر في الإطار الزمني الأدنى
- يحسن سير عمل التحليل متعدد الأطر الزمنية
عرض جميع فجوات القيمة العادلة
- اضبط "الفجوة للعرض" على -1 لعرض جميع فجوات القيمة العادلة التاريخية بدون حد
- رؤية كاملة لسلوك الفجوات عبر مخططك
- تتبع أنماط ملء الفجوات مع مرور الوقت
واجهة مستخدم نظيفة وبسيطة
- تسميات غير متطفلة مصممة للوضوح
- معلوماتية دون ازدحام عرض السعر
- عرض احترافي لتحليل مركز
__________________________________________________________________________________________
مزيد من المؤشرات المجانية
استكشف مجموعة واسعة من أدوات تحليل السوق — من الهيكل والحجم إلى الانحدار، التقلب، والأطر الزمنية المخصصة.
رمز المصدر متاح على مستودع GitHub.
جميعها مجانية للاستخدام. ولكن إذا رغبت في دعم القهوة، يمكنك توجيه الدعم من هنا.
الدعم/المقاومة
الحجم
- محلل نشاط الحجم
- محلل كفاءة الحجم
- تحليلات ملف الحجم
- ملف الحجم - محدث
- تحليل انتشار الحجم
- متوسط السعر المرجح بالحجم (VWAP)
المتوسطات المتحركة
- قناة SSL
- المتوسط المتحرك المثبت
- المتوسط المتحرك بمقياس الانحراف
- مُفعّل جان العالي والمنخفض
- خط الاتجاه اللحظي
- متوسط متحرك كوفمان التكيفي مع رؤية الاتجاه
- قناة المتوسط المتحرك
- مجموعة المتوسطات المتحركة
- متوسط متحرك قناة الاتجاه
الأدوات/المخصصة
مبني على الانحدار
التقلب
المذبذبات
__________________________________________________________________________________________
إخلاء المسؤولية
التداول ينطوي على مخاطر. هذا المؤشر مخصص للتحليل الفني فقط — يرجى دائمًا تطبيق إدارة المخاطر المناسبة والتداول بمسؤولية.
التعليقات والتحسينات
إذا كانت لديك اقتراحات أو طلبات ميزات أو أفكار للتحسين، يرجى ترك تعليق في تبويب النقاش. تساعد ملاحظاتك في تحسين المؤشر للجميع.
الملخص
The indicator displays the precise age of each gap in years, months, weeks, and days, aiding traders in prioritizing fresh versus stale gaps. It projects five Fibonacci retracement levels (23.6%, 38.2%, 50%, 61.8%, 78.6%) on partial and filled gaps, providing predefined entry zones based on Fibonacci ratios without manual drawing.
Fair Value Gap (Extended) supports multi-timeframe analysis by scanning higher timeframe gaps and displaying them on lower timeframe charts, facilitating alignment of structural gaps with price action. It offers options to extend filled gap boxes to the current bar and to display unlimited historical gaps for comprehensive gap behavior tracking.
The indicator features a clean, minimal user interface with non-intrusive labels, delivering clear liquidity imbalance insights for traders focusing on gap fills and Fibonacci-based entries.
تقييمات العملاء
5 | 100 % | |
4 | 0 % | |
3 | 0 % | |
2 | 0 % | |
1 | 0 % |


![شعار "[Stellar Strategies] MARSI Signal Plotter"](https://cdn.ctrader.com/image/webp/7b2b8da6-8f8e-4646-8d4a-4710c516c01e_25567)