
الوصف
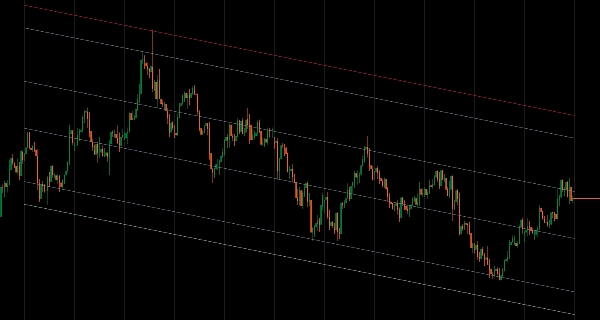
قنوات السعر الإحصائية مع أوضاع حساب مرنة وعرض نطاقات بناءً على الانحراف.
تلائم خطوط الانحدار عبر بيانات السعر باستخدام وضع الفترة (آخر N شريطًا)، وضع التاريخ والوقت (من تواريخ محددة)، أو آلية القفل لتجميد التحليل عند نقاط تاريخية بينما يستمر السعر.
ثلاث طرق للانحراف (المتوسط، المستقل، الأقصى) للقنوات المتماثلة وغير المتماثلة، ستة مستويات ارتداد فيبوناتشي (من 11.4% إلى 88.6%)، تحليل متعدد الأطر الزمنية، ستة أنواع من الأسعار (الافتتاح/الأعلى/الأدنى/الإغلاق/الوسيط/النموذجي)، وضع التاريخ فقط لاختبار رجعي مستقر، وخيار التمديد إلى اللانهاية لتقديم تحليل انحدار شامل للمتداولين الذين يستهدفون مناطق الانعكاس المتوسط والحدود السعرية الإحصائية عبر ظروف السوق.
الميزات
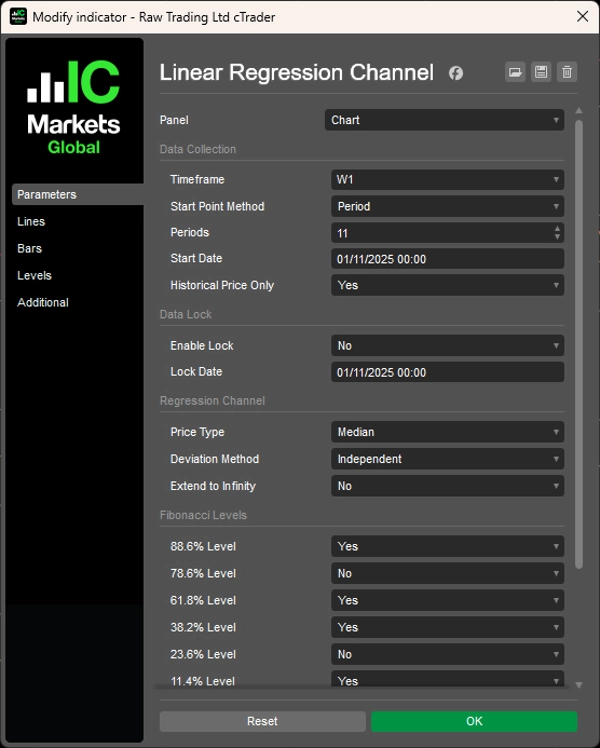
اختيار بيانات مرن
- وضع الفترة: تحليل آخر N شريطًا (مثلاً، آخر 12 شمعة شهرية)
- وضع التاريخ والوقت: البدء من أحداث أو تواريخ سوق محددة
- آلية القفل: تجميد التحليل عند نقطة تاريخية بينما يستمر السعر
- متعدد الأطر الزمنية: رسم الانحدار من أي إطار زمني على الرسم البياني الحالي
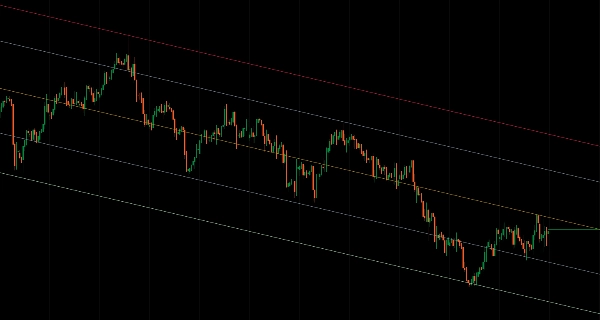
طرق الانحراف الذكية
- المتوسط: مستويات متوازنة باستخدام الانحرافات المتوسطة — مثالية لمناطق التداول
- المستقل: قنوات غير متماثلة تتكيف مع تقلب الاتجاه
- الأقصى: يعرض حدود السعر القصوى لتحليل النطاق الكامل
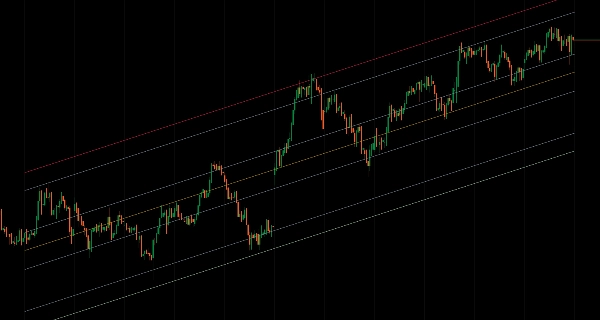
أدوات التحليل المهنية
- 6 مستويات ارتداد فيبوناتشي (11.4%، 23.6%، 38.2%، 61.8%، 78.6%، 88.6%)
- 6 أنواع من الأسعار: الافتتاح، الأعلى، الأدنى، الإغلاق، الوسيط، النموذجي
- وضع التاريخ فقط: استبعاد الأشرطة المتشكلة لاختبار رجعي مستقر
- خيار التمديد إلى اللانهاية للتوقعات طويلة الأجل
تخصيص كامل
- تخصيص كامل للألوان لجميع عناصر القناة
- تحكم مستقل في خط الانحدار ونطاقات الانحراف
- عرض بصري نظيف لتحليل مركز
قدرات متقدمة
- ميزة القفل للدراسات التحليلية القائمة على الأحداث
- دمج هيكل الإطار الزمني الأعلى مع تنفيذ الإطار الزمني الأدنى
- خيارات القنوات المتماثلة وغير المتماثلة لظروف سوق مختلفة
__________________________________________________________________________________________
مزيد من المؤشرات المجانية
استكشف مجموعة واسعة من أدوات تحليل السوق — من الهيكل والحجم إلى الانحدار، التقلب، والأطر الزمنية المخصصة.
رمز المصدر متاح على مستودع GitHub.
كلها مجانية للاستخدام. ولكن إذا رغبت في دعم القهوة، يمكنك التبرع هنا.
الدعم/المقاومة
الحجم
- محلل نشاط الحجم
- محلل كفاءة الحجم
- تحليلات ملف الحجم
- ملف الحجم - محدث
- تحليل انتشار الحجم
- VWAP (متوسط السعر المرجح بالحجم)
المتوسطات المتحركة
- قناة SSL
- المتوسط المتحرك المثبت
- المتوسط المتحرك بمقياس الانحراف
- منشط جان العالي والمنخفض
- خط الاتجاه اللحظي
- متوسط متحرك تكيفي كوفمان مع رؤية الاتجاه
- قناة المتوسط المتحرك
- مجموعة المتوسطات المتحركة
- متوسط قناة الاتجاه المتحرك
الأدوات/المخصصة
قائم على الانحدار
التقلب
المذبذبات
__________________________________________________________________________________________
إخلاء المسؤولية
التداول ينطوي على مخاطر. هذا المؤشر مخصص للتحليل الفني فقط — يرجى دائمًا تطبيق إدارة مخاطر مناسبة والتداول بمسؤولية.
التعليقات والتحسينات
إذا كانت لديك اقتراحات أو طلبات ميزات أو أفكار لتحسين، يرجى ترك تعليق في تبويب المناقشة. تساعد ملاحظاتك في تحسين المؤشر للجميع.
الملخص
تقييمات العملاء
5 | 100 % | |
4 | 0 % | |
3 | 0 % | |
2 | 0 % | |
1 | 0 % |


