
Descripción
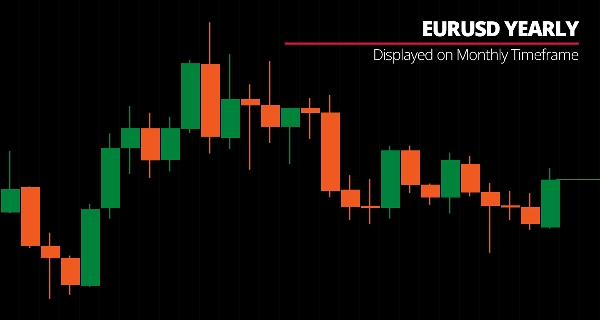
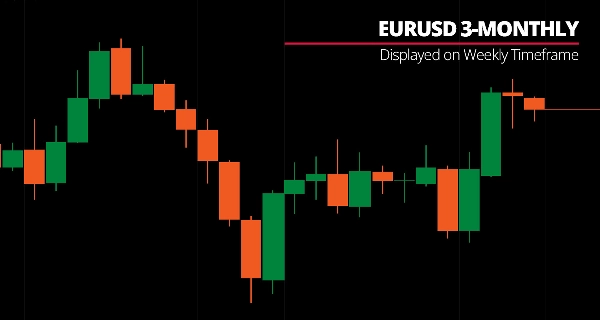
Mostrar los marcos de tiempo nativos de cTrader y períodos no estándar (5H, 7H, 9H, 4 días, 2 semanas, 3 meses, anual) como velas personalizadas con conmutación de marco de tiempo basada en interruptores.
Representa velas de períodos personalizados en cualquier gráfico—desde barras de 25 minutos hasta períodos anuales—con botones de conmutación de marco de tiempo para cambiar rápidamente entre períodos.
Opciones completas de períodos (minutos/horas/días/semanas/meses personalizados), velas visuales alcistas/bajistas con grosor de mecha configurable y controles de conmutación para un cambio rápido de marco de tiempo que ofrecen un análisis flexible de múltiples marcos para traders que necesitan períodos entre intervalos estándar de gráficos.
CARACTERÍSTICAS
Opciones Completas de Períodos
- Períodos de Minutos Personalizados: 25m, 35m, 50m, 55m
- Períodos Horarios Personalizados: 5H, 7H, 9H-23H (cada hora de 5 a 23)
- Diarios/Semanales/Mensuales Personalizados: 4 días, 2 semanas, 3 semanas, 2 meses, 3 meses, 4 meses, 6 meses, anual
- Marcos de Tiempo Nativos: Todos los períodos estándar (m1-Mensual) con visualización mejorada
Barras de Marco de Tiempo Personalizado
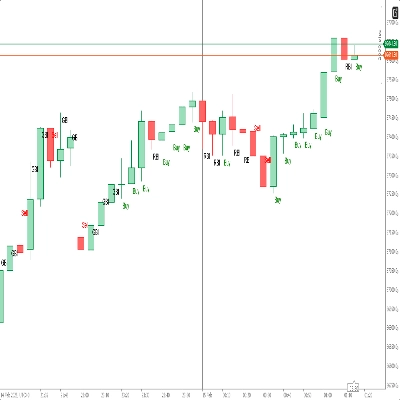
- Velas visuales para períodos personalizados con coloración alcista/bajista
- Grosor de mecha configurable
- Visualización limpia del gráfico—ocultar barras nativas, mostrar solo la estructura de período personalizado
- Seguimiento en tiempo real de la formación
Controles de Conmutación
- Botones rápidos de encendido/apagado para barras personalizadas, líneas OHLC, MA
- Interfaz limpia para gestión rápida de funciones
- Configuración flexible de visualización
__________________________________________________________________________________________
MÁS INDICADORES GRATUITOS
Explora una amplia gama de herramientas de análisis de mercado—desde estructura y volumen hasta regresión, volatilidad y marcos de tiempo personalizados.
El código fuente está disponible en el repositorio de GitHub.
Todos son gratuitos para usar. Pero si deseas apoyar con un café, puedes hacerlo aquí.
Soporte/Resistencia
Volumen
- Perfilador de Actividad de Volumen
- Analizador de Eficiencia de Volumen
- Análisis de Perfil de Volumen
- Perfil de Volumen - Actualizado
- Análisis de Dispersión de Volumen
- VWAP (Precio Promedio Ponderado por Volumen)
Medias Móviles
- Canal SSL
- Media Móvil Anclada
- Media Móvil Escalada por Desviación
- Activador Gann High Low
- Línea de Tendencia Instantánea
- MA Adaptativa de Kaufman con Visión de Tendencia
- Canal de Media Móvil
- Suite de Medias Móviles
- Media Móvil de Canal de Tendencia
Utilidades/Personalizados
Basado en Regresión
Volatilidad
Osciladores
__________________________________________________________________________________________
DESCARGO DE RESPONSABILIDAD
El trading implica riesgos. Este indicador está destinado solo para análisis técnico — siempre aplique una gestión adecuada del riesgo y opere con responsabilidad.
COMENTARIOS Y MEJORAS
Si tienes sugerencias, solicitudes de funciones o ideas para mejoras, por favor deja un comentario en la pestaña de Discusión. Tus comentarios ayudan a mejorar el indicador para todos.
Resumen
Valoraciones de clientes
5 | 100 % | |
4 | 0 % | |
3 | 0 % | |
2 | 0 % | |
1 | 0 % |


![Logotipo de "Smart Money Concepts (SMC) [Iridio Capital]"](https://cdn.ctrader.com/image/webp/28b69fd1-ef54-4bed-9487-07e78e883be4_40934)


