
설명
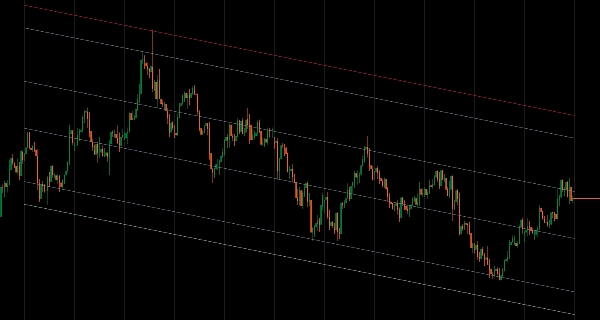
유연한 계산 모드와 편차 기반 밴드 렌더링을 갖춘 통계적 가격 채널.
기간 모드(최근 N개 바), 날짜/시간 모드(특정 날짜부터) 또는 잠금 메커니즘을 사용하여 가격 데이터에 회귀선을 맞추고, 가격이 계속 움직이는 동안 분석을 과거 시점에 고정합니다.
대칭 및 비대칭 채널을 위한 세 가지 편차 방법(평균, 독립, 최대), 6개의 피보나치 되돌림 수준(11.4%~88.6%), 다중 타임프레임 분석, 6가지 가격 유형(시가/고가/저가/종가/중간값/전형값), 안정적인 백테스트를 위한 과거 전용 모드, 무한 확장 투영 기능을 통해 시장 상황 전반에 걸쳐 평균 회귀 구역과 통계적 가격 경계를 목표로 하는 트레이더에게 포괄적인 회귀 분석을 제공합니다.
특징
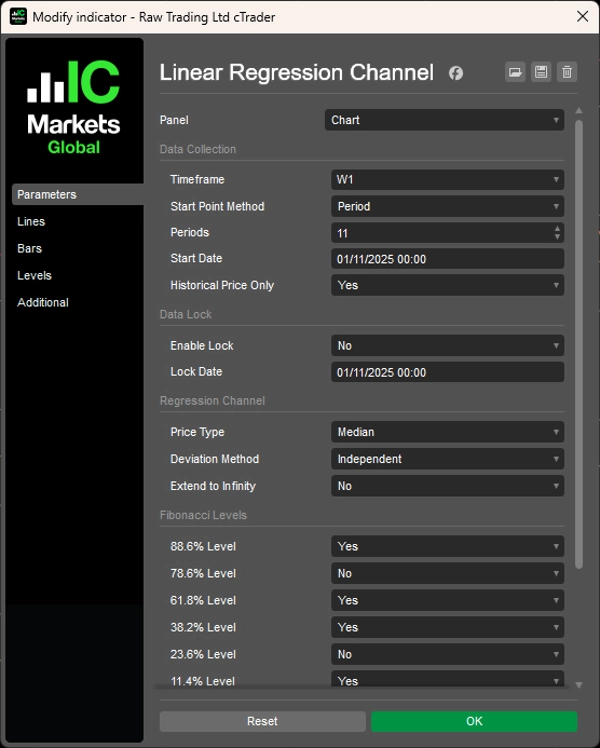
유연한 데이터 선택
- 기간 모드: 최근 N개 바 분석(예: 최근 12개월 캔들)
- 날짜/시간 모드: 특정 시장 이벤트 또는 날짜부터 시작
- 잠금 메커니즘: 가격이 계속 움직이는 동안 과거 시점에서 분석 고정
- 다중 타임프레임: 현재 차트에서 모든 타임프레임의 회귀선 그리기
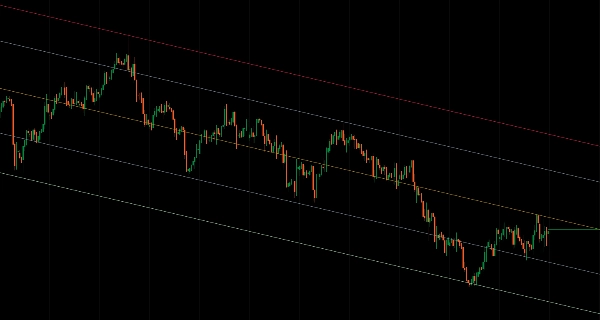
스마트 편차 방법
- 평균: 평균 편차를 사용한 균형 잡힌 수준 — 거래 구역에 이상적
- 독립: 방향성 변동성에 적응하는 비대칭 채널
- 최대: 전체 범위 분석을 위한 극단적 가격 경계 표시
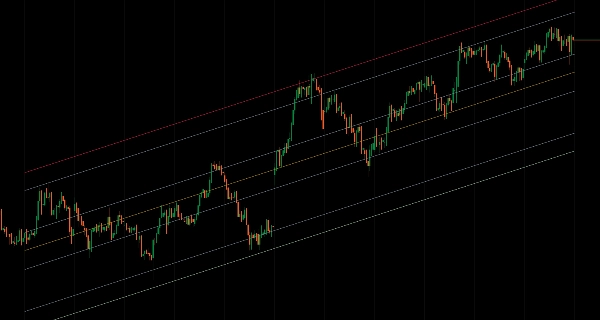
전문 분석 도구
- 6개의 피보나치 되돌림 수준(11.4%, 23.6%, 38.2%, 61.8%, 78.6%, 88.6%)
- 6가지 가격 유형: 시가, 고가, 저가, 종가, 중간값, 전형값
- 과거 전용 모드: 안정적인 백테스트를 위해 형성 중인 바 제외
- 장기 투영을 위한 무한 확장 옵션
완전한 사용자 정의
- 모든 채널 요소에 대한 완전한 색상 사용자 정의
- 회귀선과 편차 밴드에 대한 독립적 제어
- 집중된 분석을 위한 깔끔한 시각적 표현
고급 기능
- 이벤트 기반 분석 연구를 위한 잠금 기능
- 상위 타임프레임 구조와 하위 타임프레임 실행 결합
- 다양한 시장 상황에 맞는 대칭 및 비대칭 채널 옵션
__________________________________________________________________________________________
더 많은 무료 지표
구조와 거래량부터 회귀, 변동성, 맞춤 타임프레임에 이르기까지 다양한 시장 분석 도구를 탐색하세요.
소스 코드는 GitHub 저장소에서 확인할 수 있습니다.
모두 무료로 사용 가능합니다. 하지만 커피 지원을 보내고 싶다면 여기로 보내실 수 있습니다.
지지/저항
거래량
이동 평균
유틸리티/커스텀
회귀 기반
변동성
오실레이터
__________________________________________________________________________________________
면책 조항
거래에는 위험이 따릅니다. 이 지표는 기술적 분석용으로만 의도되었으며 항상 적절한 위험 관리와 책임 있는 거래를 적용하세요.
피드백 및 개선 사항
제안, 기능 요청 또는 개선 아이디어가 있으시면 토론 탭에 댓글을 남겨주세요. 여러분의 피드백은 모두를 위한 지표 개선에 도움이 됩니다.
요약
고객 리뷰
5 | 100 % | |
4 | 0 % | |
3 | 0 % | |
2 | 0 % | |
1 | 0 % |


!["[Hamster-Coder] Moving Average MTF" 로고](https://cdn.ctrader.com/image/webp/b11b98b1-194d-4b8e-b00e-d611826ad159_31226)

