설명
개요
Volume Spread Analysis (VSA)는 전 신디케이트 트레이더인 Tom Williams가 1900년대 초 Richard Wyckoff의 연구를 바탕으로 개발한 방법론입니다. VSA는 거래량, 가격 범위(스프레드), 종가 위치 간의 관계를 해석하여 수요와 공급의 불균형을 식별합니다.
주요 VSA 개념:
- 거래량은 활동량을 보여줍니다 - 누가 참여하고 있는지
- 스프레드는 변동성과 불확실성을 보여줍니다 - 가격이 얼마나 움직였는지
- 종가 위치는 누가 바를 이겼는지 보여줍니다 - 매수자 또는 매도자
- 맥락는 시장 주기 내 위치를 보여줍니다 - 강세 또는 약세 단계
거래량이 증가하고 스프레드가 넓지만 가격 진전이 거의 없으면 흡수(한 쪽이 다른 쪽의 압력을 흡수하는 것)를 시사합니다. 추세에서 거래량이 감소하고 스프레드가 좁으면 참여 부족(잠재적 약세)을 나타냅니다.
이 구현:
이 지표는 통계적 방법을 사용하여 VSA 개념을 정량화합니다. 전통적인 VSA와 여러 면에서 다릅니다:
- 효율성 지표로
(close - open) / range사용 (원래 VSA에는 없음) - 흡수 패턴은 전통적인 "압력 흡수" 대신 "한 쪽의 승리"를 식별
- ENR (Effort No Result)은 효율성 임계값을 사용해 정량화; 원래 VSA는 더 해석적임
- 거래량 평균에 트림 평균(이상치 저항)과 스프레드에 백분위 순위 사용
- 다음은 포함하지 않음: Stopping Volume, Upthrust, Test, Shakeout 패턴
이것은 VSA 개념에 대한 정량적이고 알고리즘적인 접근법입니다. 전통적인 VSA는 더 해석적이고 맥락에 의존적입니다. 이 지표를 단독 신호가 아닌 여러 분석 도구 중 하나로 사용하세요.
이 지표가 하는 일
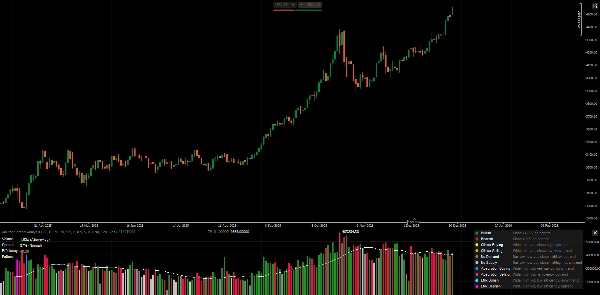
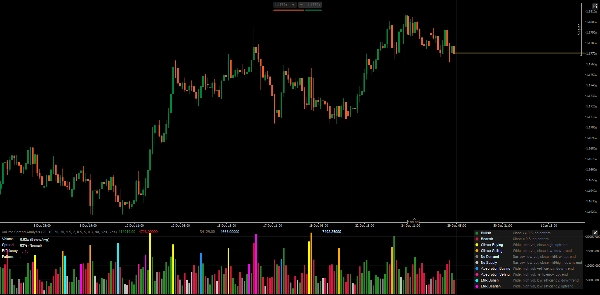
각 바의 거래량, 스프레드, 종가 위치를 분석하여 잠재적 수요/공급 불균형을 감지합니다. 패턴 유형별로 색칠된 거래량 히스토그램과 실시간 메트릭 패널을 표시합니다.
패턴 정의
1. 표준 바 (패턴 없음)
- 강세: 종가가 범위 내 0.5 이상, 특별한 패턴 없음
- 약세: 종가가 범위 내 0.5 미만, 특별한 패턴 없음
2. 클라이맥스 패턴 (잠재적 소진)
- 클라이맥스 매수: 넓은 스프레드 + 초고거래량 + 종가 고가 + 상승 추세
-
- 해석: 매수 소진 가능성, 반전 주시
- 클라이맥스 매도: 넓은 스프레드 + 초고거래량 + 종가 저가 + 하락 추세
-
- 해석: 매도 소진 가능성, 반전 주시
3. 약한 패턴 (확신 부족)
- 수요 부족: 좁은 스프레드 + 낮은 거래량 + 종가 중간/저가 + 상승 추세
-
- 해석: 매수자가 랠리를 지지하지 않음, 잠재적 약세
- 공급 부족: 좁은 스프레드 + 낮은 거래량 + 종가 중간/고가 + 하락 추세
-
- 해석: 매도자가 하락을 밀어내지 않음, 잠재적 강세
4. 흡수 패턴 (한 쪽의 승리)
- 흡수 매수: 넓은 스프레드 + 높은 거래량 + 양의 효율성 + 하락 추세
-
- 해석: 매수자가 매도 압력을 흡수, 잠재적 반등 상승
- 흡수 매도: 넓은 스프레드 + 높은 거래량 + 음의 효율성 + 상승 추세
-
- 해석: 매도자가 매수 압력을 흡수, 잠재적 반전 하락
5. ENR 패턴 (명확한 결과 없는 노력)
- ENR 강세: 넓은 스프레드 + 높은 거래량 + 낮은 효율성 + 하락 추세
-
- 해석: 높은 노력에도 명확한 승자 없음, 잠재적 지지/우유부단
- ENR 약세: 넓은 스프레드 + 높은 거래량 + 낮은 효율성 + 상승 추세
-
- 해석: 높은 노력에도 명확한 승자 없음, 잠재적 저항/우유부단
메트릭 패널 설명
거래량
- 현재 바 거래량을 트림 평균 대비 비율로 표시 (예: "1.85x")
- 분류: 낮음 / 평균 이하 / 평균 이상 / 높음 / 초고
- 높은 거래량 = 시장 참여, 하지만 맥락이 중요함
스프레드
- 최근 바 대비 백분위 순위(0-100%) 표시
- 분류: 좁음 / 보통 / 넓음
- 넓은 스프레드 = 변동성/불확실성, 반드시 방향성은 아님
효율성
- 공식:
(close - open) / (high - low) - 범위: -1.0 ~ +1.0
- 양수 = 강세 몸통이 범위를 지배
- 음수 = 약세 몸통이 범위를 지배
- 0 근처 = 작은 몸통, 긴 꼬리, 우유부단
패턴
- 현재 감지된 패턴 (없으면 "-")
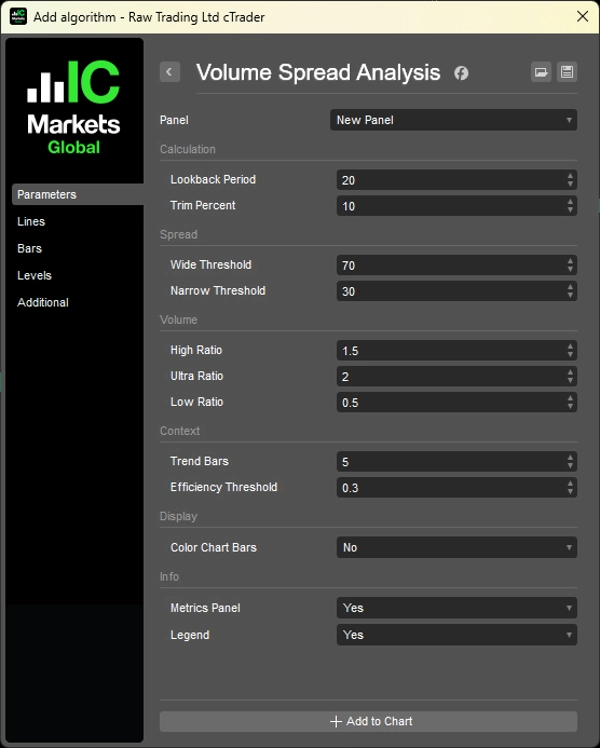
매개변수
1. 계산
- 회고 기간 (20): 거래량/스프레드 통계에 사용되는 바 수
- 트림 백분율 (10%): 거래량 계산에서 이상치 제거
2. 스프레드 분류
- 넓은 임계값 (70%): "넓음"으로 분류하는 백분위
- 좁은 임계값 (30%): "좁음"으로 분류하는 백분위
3. 거래량 분류
- 높은 비율 (1.5x): 평균 이상 임계값
- 초고 비율 (2.0x): 초고 임계값
- 낮은 비율 (0.5x): 평균 이하 임계값
4. 맥락
- 추세 바 (5): 추세 방향 비교를 위한 이전 바 수
- 효율성 임계값 (0.3): "강한" 효율성의 최소값
5. 표시
- 차트 바 색상: 가격 차트에 패턴 색상 적용
- 메트릭 패널: 실시간 메트릭 표시
- 범례: 패턴 참조 가이드 표시
사용 방법
1. 패턴을 직접 거래 신호로 사용하지 마세요 - 잠재적 맥락을 나타내며 진입 신호는 아닙니다.
2. 가격 구조와 결합하세요 - VSA는 가격 구조가 보여주는 것을 확인할 때 가장 효과적입니다.
3. 맥락을 주시하세요 - 같은 패턴도 지지선과 저항선에서 의미가 다를 수 있습니다.
4. 거래량 관점이 중요합니다 - 주요 수준에서의 높은 거래량 흡수가 임의 바 흡수보다 중요합니다.
외환 거래량 제한
외환 현물 시장은 틱 거래량(가격 변동 횟수)을 보여주며, 실제 거래된 계약 수는 아닙니다. 패턴은 실제 거래량 데이터가 있는 선물/주식보다 신뢰도가 낮을 수 있습니다.
범례 (내장 참조)
"범례" 매개변수를 활성화하면 차트에 패턴 설명이 직접 표시됩니다.
__________________________________________________________________________________________
더 많은 무료 지표
구조와 거래량부터 회귀, 변동성, 맞춤 시간 프레임에 이르기까지 다양한 시장 분석 도구를 탐색하세요.
소스 코드는 GitHub 저장소에서 확인할 수 있습니다.
모두 무료로 사용할 수 있습니다. 커피 지원을 보내고 싶다면 여기로 보내실 수 있습니다.
지지/저항
거래량
이동 평균
- SSL 채널
- 고정 이동 평균
- 편차 스케일 이동 평균
- 간 하이 로우 액티베이터
- 순간 추세선
- 트렌드 비전이 포함된 카우프만 적응형 MA
- 이동 평균 채널
- 이동 평균 모음
- 추세 채널 이동 평균
유틸리티/맞춤형
회귀 기반
변동성
오실레이터
__________________________________________________________________________________________
면책 조항
거래에는 위험이 따릅니다. 이 지표는 기술적 분석용으로만 의도되었으며 항상 적절한 위험 관리와 책임 있는 거래를 적용하세요.
피드백 및 개선사항
제안, 기능 요청 또는 개선 아이디어가 있으면 토론 탭에 댓글을 남겨주세요. 여러분의 피드백은 모든 사용자를 위한 지표 개선에 도움이 됩니다.
요약
This implementation quantifies VSA concepts using statistical methods, including an efficiency metric defined as (close - open) / range, trimmed mean volume averaging, and percentile ranking for spread. It identifies several bar patterns: Standard (bullish/bearish), Climax (buying/selling exhaustion), Weak (No Demand/No Supply), Absorption (one side winning), and ENR (Effort No Result), each indicating different market conditions.
The indicator displays a volume histogram colored by detected pattern type and provides a real-time metrics panel showing volume ratio, spread percentile, efficiency, and current pattern. Parameters allow customization of lookback periods, volume/spread thresholds, and display options such as coloring chart bars and showing a pattern legend.
VSA is applicable across markets including Forex, stocks, indices, commodities, and crypto. Note that Forex volume reflects tick volume, which may affect pattern reliability. The indicator is designed as an analytical tool to complement price structure analysis rather than as standalone trade signals.
고객 리뷰
5 | 100 % | |
4 | 0 % | |
3 | 0 % | |
2 | 0 % | |
1 | 0 % |