
설명
향상된 MACD 히스토그램을 소개합니다. 더 명확하고 통찰력 있는 거래 경험을 제공하도록 설계되었습니다.
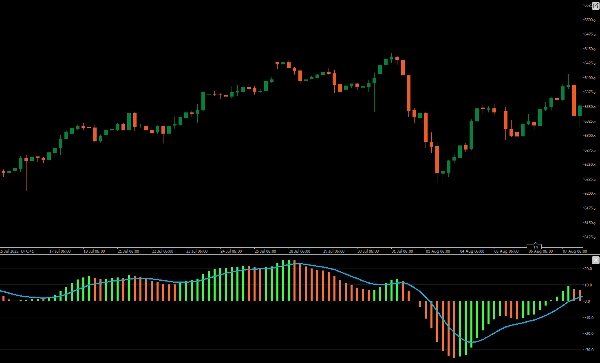
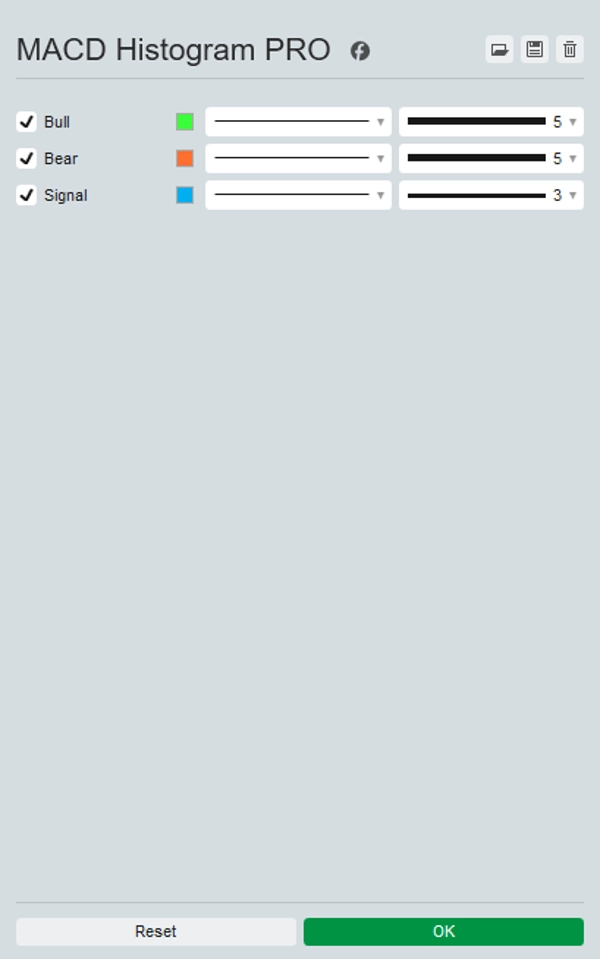
이 업그레이드된 지표는 기본 단일 색상 형식을 넘어 강세와 약세 가격 변동을 구분하는 생생한 색상의 히스토그램을 표시합니다. 양수 및 음수 움직임에 대해 뚜렷한 색상을 사용함으로써 시장 상황에 대한 즉각적인 시각적 신호를 제공하여 모멘텀 변화와 잠재적 추세 반전을 해석하기 쉽게 만듭니다.
더 향상된 명확성과 정밀함을 추구하는 트레이더에게 완벽한 이 MACD 히스토그램 업그레이드는 차트를 더 강력한 분석 도구로 변모시킵니다. 향상된 MACD 히스토그램으로 거래 전략을 한 단계 끌어올리세요.
요약
AI 요약
MACD Histogram PRO is an enhanced technical indicator designed to improve the visualization of the traditional MACD histogram. It displays a vibrant, color-coded histogram that clearly differentiates bullish and bearish price movements, providing immediate visual cues on market momentum and potential trend reversals. This indicator supports analysis across various markets and symbols including Forex (EURUSD, GBPUSD, NZDUSD, USDJPY), cryptocurrencies (BTCUSD, crypto), commodities (XAUUSD, gold, oil, silver), indices (NAS100, SP500, DAX, Dow), and stocks. By using distinct colors for positive and negative momentum shifts, it aids traders in interpreting market conditions with greater clarity and precision. The MACD Histogram PRO is suitable for strategies involving signals and scalping, enhancing chart analysis for more informed trading decisions.
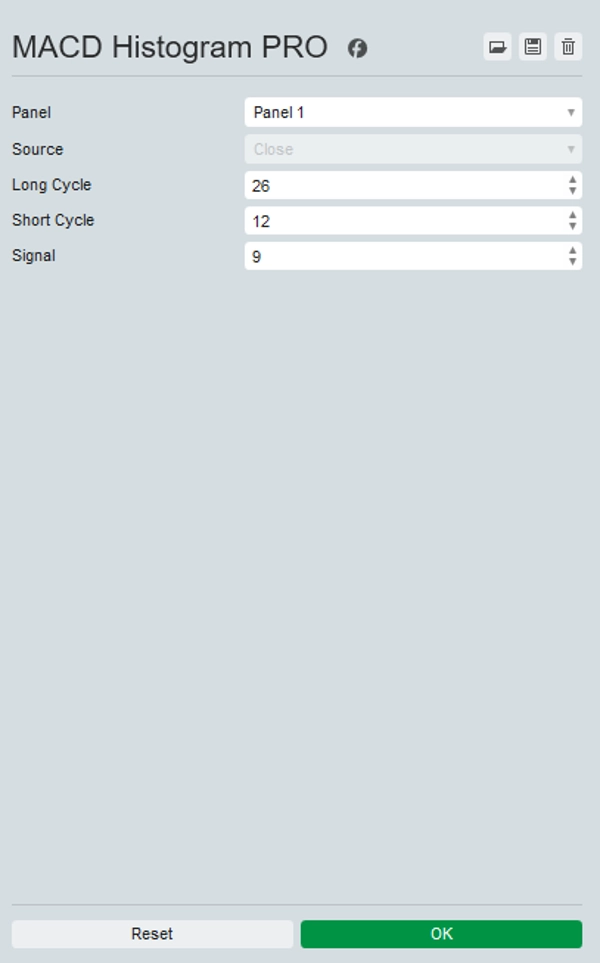
지표 프로필
고객 리뷰
4.5
리뷰: 2
5 | 50 % | |
4 | 50 % | |
3 | 0 % | |
2 | 0 % | |
1 | 0 % |
고객 리뷰
October 22, 2025
the only reason it stays interesting is one quick look should not become the only input, and 1.5R target is the line to watch.
October 17, 2025
상담
자주 묻는 질문(FAQ)
BTCUSD
Forex
Signal
Indices
EURUSD
Commodities
GBPUSD
NZDUSD
Prop
Scalping
Crypto
Stocks
XAUUSD
NAS100
MACD
USDJPY
트레이딩 봇, 지표, 플러그인 등 cTrader Store에서 제공되는 상품은 제3자 개발자에 의해 제공되며, 이는 단순히 정보 및 기술적 접근을 목적으로 제공된 것입니다. cTrader Store는 중개인이 아니며, 투자 조언, 개인별 추천 또는 향후 성과에 대한 어떠한 보장도 제공하지 않습니다.


!["[Hamster-Coder] Pivot Points MTF" 로고](https://cdn.ctrader.com/image/webp/4c143e5a-309c-40e3-a578-f04d1e133ffa_31159)


가격
가입일 25/09/2025
25
판매
315
무료 설치