
설명
주요 고점 및 저점 지표: 종합 개요
소개
빠르게 변화하는 트레이딩 세계에서 적절한 도구를 갖추는 것은 큰 차이를 만듭니다. 주요 고점 및 저점 지표는 시장의 중요한 전환점을 식별하도록 설계되어 트레이더가 정보에 입각한 결정을 내릴 수 있게 합니다. 이 강력한 도구는 고급 알고리즘을 활용하여 중요한 고점과 저점을 정확히 찾아내어 트레이딩 전략을 강화하고 전반적인 성과를 향상시킵니다. 45분 타임프레임에서 약 60%에서 70%의 평균 정확도를 가진 이 지표는 시장 움직임을 활용하려는 트레이더에게 신뢰할 수 있는 자산이며, 데이 트레이더와 스캘퍼 모두에게 이상적입니다.
주요 특징
1. 시각적 표현
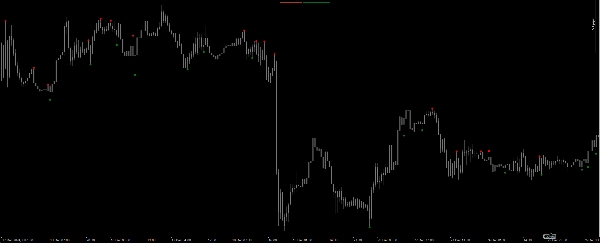
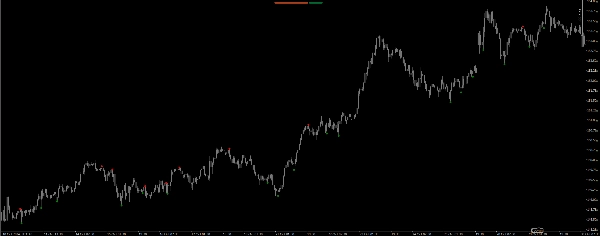
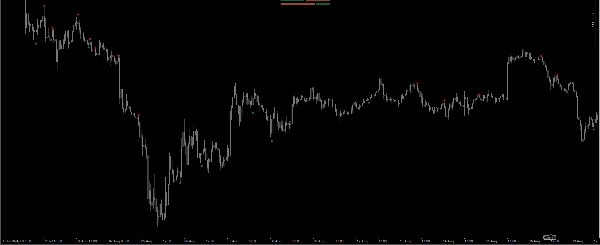
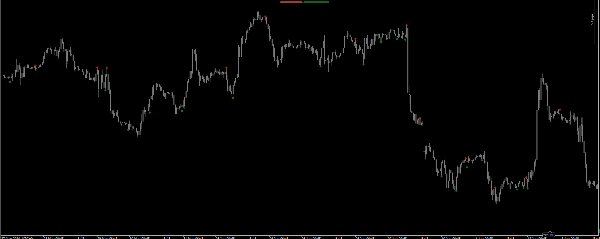
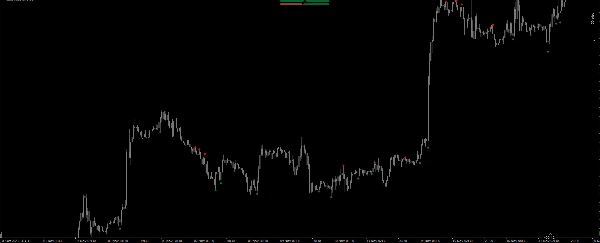
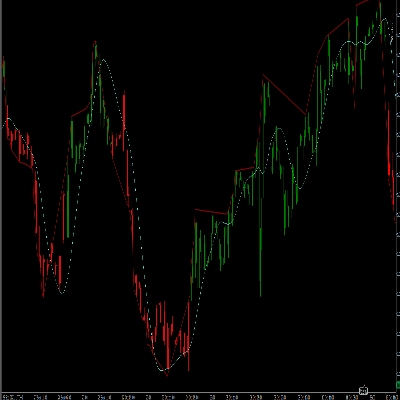
주요 고점 및 저점 지표는 시장 동향을 명확하게 시각적으로 표현합니다. 주요 고점은 빨간색, 주요 저점은 녹색으로 표시되어 트레이더가 잠재적 반전 지점을 빠르게 식별할 수 있습니다. 포인트 사용으로 이러한 중요한 수준이 차트에서 돋보이게 되어 한눈에 트레이딩 기회를 쉽게 포착할 수 있습니다.
2. 정확한 계산
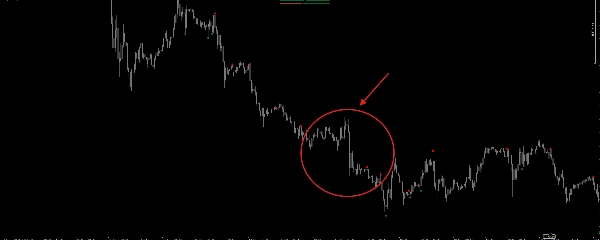
주요 고점 및 저점 지표의 핵심은 계산 방법에 있습니다. 최근 4개의 바 가격 움직임을 분석하여 주요 고점 또는 저점이 형성되었는지 판단합니다. 이는 고가와 저가를 일련의 비교를 통해 이루어지며, 중요한 전환점만을 정확히 식별합니다.
3. 향상된 스캘핑 기법
스캘핑을 전문으로 하는 트레이더에게 주요 고점 및 저점 지표는 매우 귀중한 자산입니다. 주요 전환점을 식별함으로써 트레이더는 정확하게 포지션에 진입하고 청산할 수 있습니다. 주요 고점과 저점을 빠르게 포착하는 능력은 타이트한 이익 실현(TP) 및 손절매(SL) 설정을 가능하게 하여 위험을 최소화하면서 잠재적 이익을 극대화합니다. 45분 타임프레임에서 약 60%에서 70%의 정확도를 감안할 때, 신호가 놓칠 경우 잠재적 손실을 줄이기 위해 손절매 사용을 강력히 권장합니다.
주요 고점 및 저점 지표 사용의 이점
1. 향상된 의사결정
주요 고점 및 저점 지표는 정확한 시장 분석을 기반으로 트레이더가 정보에 입각한 결정을 내릴 수 있도록 지원합니다. 중요한 고점과 저점을 식별함으로써 트레이더는 가격 움직임을 더 잘 예측하고 전략을 조정할 수 있습니다. 이러한 향상된 의사결정 과정은 전반적인 트레이딩 성과를 높입니다.
2. 수익 잠재력 증가
중요한 전환점을 정확히 찾아내어 트레이더가 시장 반전을 보다 효과적으로 활용할 수 있습니다. 주요 고점 및 저점 지표는 최적의 시점에 포지션에 진입할 수 있게 하여 수익 잠재력을 높입니다. 타이트한 TP 및 SL 설정을 통해 이익을 극대화하면서 위험 노출을 최소화할 수 있습니다.
3. 사용자 친화적 인터페이스
주요 고점 및 저점 지표는 사용자 경험을 고려하여 설계되었습니다. 주요 고점과 저점의 명확한 시각적 표현으로 트레이더가 지표가 제공하는 신호를 쉽게 해석할 수 있습니다. 이 사용자 친화적 인터페이스는 모든 경험 수준의 트레이더가 접근하기 쉽도록 만듭니다.
4. 다용도 적용
데이 트레이더, 스윙 트레이더 또는 스캘퍼 등 어떤 유형의 트레이더든 주요 고점 및 저점 지표는 다양한 트레이딩 전략에 적용할 수 있습니다. 그 다용성은 다양한 시장 상황에 적응할 수 있는 유연성을 제공하여 모든 트레이더의 도구 상자에 가치 있는 추가 요소가 됩니다.
결론
결론적으로, 주요 고점 및 저점 지표는 중요한 시장 전환점을 식별하여 트레이딩 전략을 향상시키는 강력한 도구입니다. 정확한 계산, 시각적 표현, 그리고 cTrader 플랫폼과의 호환성을 통해 트레이더가 정보에 입각한 결정을 내리고 시장 움직임을 활용할 수 있도록 지원합니다. 약 70%의 정확도를 가진 이 지표는 신호가 놓칠 경우 손실을 최소화하기 위해 손절매를 반드시 구현해야 합니다. 최적의 결과를 위해 45분 타임프레임에서 사용하는 것이 권장됩니다. 숙련된 트레이더든 초보자든, 주요 고점 및 저점 지표는 트레이딩 성과를 크게 향상시킬 수 있습니다. 오늘 이 혁신적인 도구를 전략에 통합하여 트레이딩 경험을 한 단계 끌어올리십시오.
요약
고객 리뷰
5 | 50 % | |
4 | 50 % | |
3 | 0 % | |
2 | 0 % | |
1 | 0 % |


!["[Hamster-Coder] Moving Average MTF" 로고](https://cdn.ctrader.com/image/webp/b11b98b1-194d-4b8e-b00e-d611826ad159_31226)
