Descrição
Estrutura de intervalo de abertura para qualquer período—sessões intradiárias a ciclos anuais—com níveis de Fibonacci e projeções de extensão.
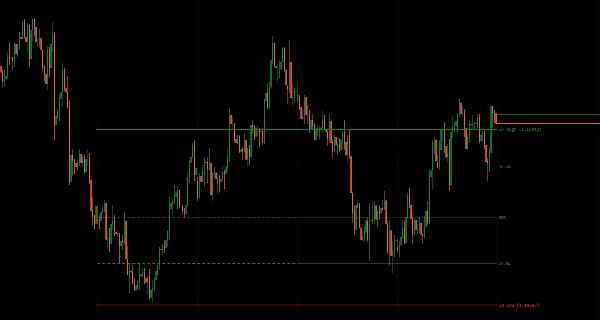
Marca o intervalo Máximo/Mínimo estabelecido durante os períodos de abertura (Diário, Semanal, Mensal, Trimestral, Anual ou Intervalo Personalizado) como referência para rompimentos, reversão à média e expectativas de volatilidade.
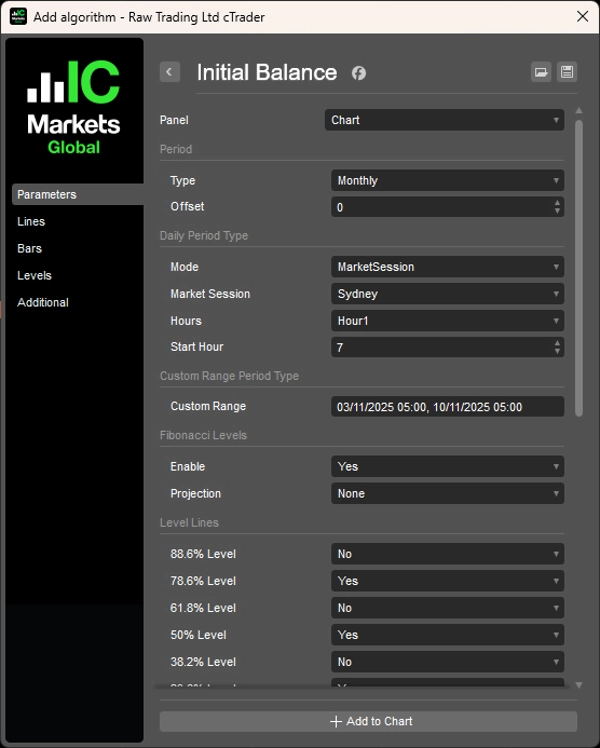
Oito tipos de período com detecção de sessão sensível ao fuso horário (Sydney/Tóquio/Londres/NY), deslocamento histórico para comparação multiperíodo, sete níveis opcionais de Fibonacci (11,4% a 88,6%) dentro do intervalo IB, projeções ascendentes/descendentes a partir dos limites, controle flexível de extensão de linha (apenas período IB, barra atual ou N períodos à frente) e detecção precisa de período oferecem uma análise abrangente do intervalo de abertura para traders que buscam setups baseados em estrutura em todos os prazos.
RECURSOS
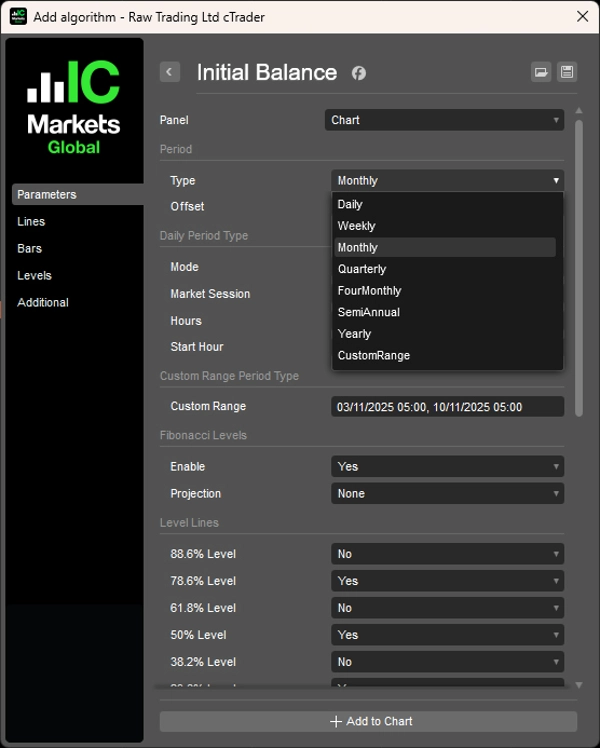
8 Tipos de Período
- Diário, Semanal, Mensal, Trimestral, 4 Meses, Semestral, Anual, Intervalo Personalizado
- Modos Diários: Baseado em horas (1-12 horas) ou Sessão de Mercado (Sydney/Tóquio/Londres/NY)
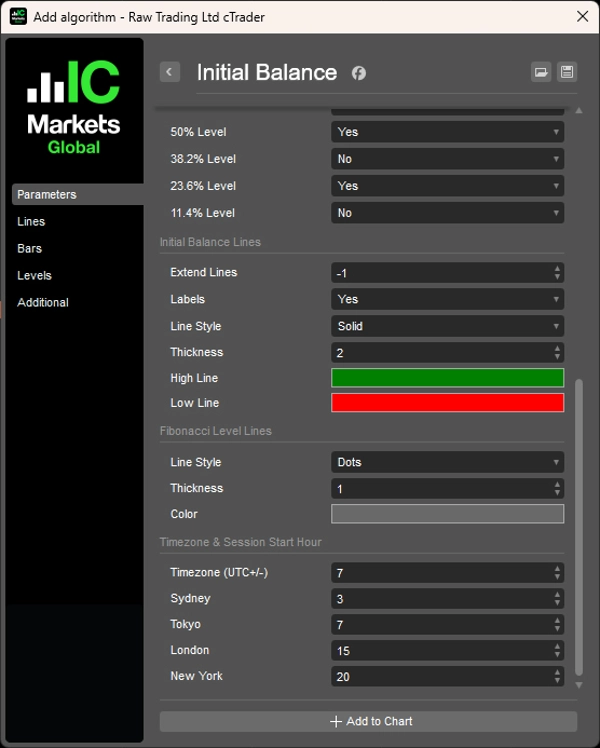
- Horários configuráveis de início de sessão com ajuste de deslocamento UTC sensível ao fuso horário
- Intervalo Personalizado: Defina data/hora exata de início/fim para análise baseada em eventos
Períodos Históricos
- Parâmetro de deslocamento para visualizar intervalos IB passados (ex.: IB da semana passada, IB do mês passado)
- Compare a ação de preço atual com estruturas de períodos anteriores
- Análise multiperíodo para confirmação de tendência
Níveis de Fibonacci
- 7 níveis opcionais (11,4%, 23,6%, 38,2%, 50%, 61,8%, 78,6%, 88,6%) dentro do intervalo IB
- Zonas de reversão à média dentro do equilíbrio
- Pontos de referência precisos para entrada/saída
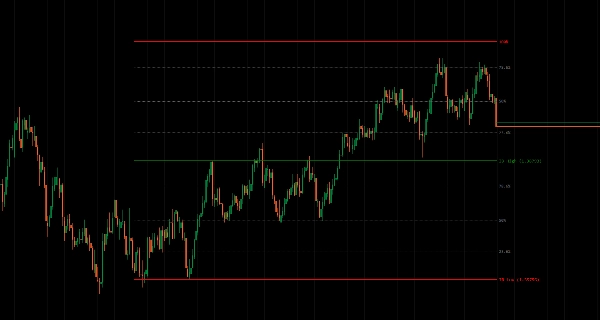
Projeções de Fibonacci
- Projete níveis para cima/baixo a partir do máximo/mínimo do IB
- Alvos potenciais de rompimento além do intervalo
- Zonas de extensão para movimentos direcionais
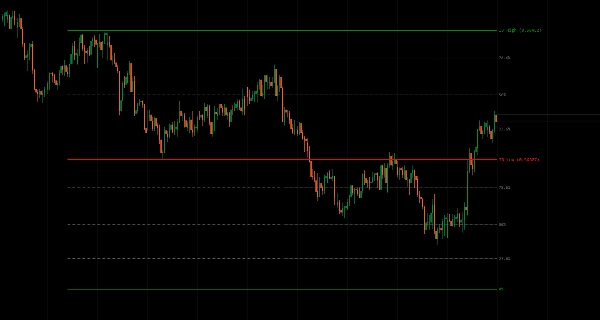
Controle de Extensão de Linha
- Apenas período IB: Mostra o intervalo durante o período de formação
- Barra atual: Estende até o presente
- N períodos à frente: Projeta para o futuro para planejamento
- Gestão visual limpa
Detecção Precisa de Período
- Cálculo preciso do intervalo de abertura para cada tipo de período
- Sensível ao fuso horário para mercados globais
- Lida com sobreposições e transições de sessão de forma limpa
__________________________________________________________________________________________
MAIS INDICADORES GRATUITOS
Explore uma ampla variedade de ferramentas de análise de mercado—desde estrutura e volume até regressão, volatilidade e prazos personalizados.
O código-fonte está disponível no repositório GitHub.
Todos gratuitos para uso. Mas se quiser enviar um suporte para café, você pode fazer isso aqui.
Suporte/Resistência
Volume
- Perfilador de Atividade de Volume
- Analisador de Eficiência de Volume
- Análise de Perfil de Volume
- Perfil de Volume - Atualizado
- Análise de Spread de Volume
- VWAP (Preço Médio Ponderado por Volume)
Médias Móveis
- Canal SSL
- Média Móvel Ancorada
- Média Móvel Escalada por Desvio
- Ativador Gann High Low
- Linha de Tendência Instantânea
- Média Móvel Adaptativa Kaufman com Visão de Tendência
- Canal de Média Móvel
- Conjunto de Médias Móveis
- Média Móvel de Canal de Tendência
Utilitários/Personalizados
Baseado em Regressão
Volatilidade
Osciladores
__________________________________________________________________________________________
AVISO LEGAL
Negociar envolve riscos. Este indicador destina-se apenas à análise técnica — sempre aplique uma gestão de risco adequada e negocie com responsabilidade.
FEEDBACK E MELHORIAS
Se você tiver sugestões, pedidos de recursos ou ideias para melhorias, por favor deixe um comentário na aba Discussão. Seu feedback ajuda a melhorar o indicador para todos.
Resumo
Key features include configurable session start times with UTC offset adjustments, historical offset parameters for comparing past initial balance ranges, and multi-period analysis for trend confirmation. It offers optional Fibonacci retracement levels (11.4% to 88.6%) within the initial balance range to highlight mean reversion zones and precise entry or exit points. Additionally, Fibonacci projections extend upward or downward from the initial balance boundaries to indicate potential breakout targets and directional extension zones.
Line extension controls allow users to display the range during its formation, extend it to the current bar, or project it forward for planning purposes. The indicator ensures precise period detection, handling session overlaps and transitions accurately for global market analysis. This tool aids traders in identifying breakout, mean reversion, and volatility expectations based on opening range structures across all timeframes.
Avaliações de clientes
5 | 50 % | |
4 | 50 % | |
3 | 0 % | |
2 | 0 % | |
1 | 0 % |