
Deskripsi
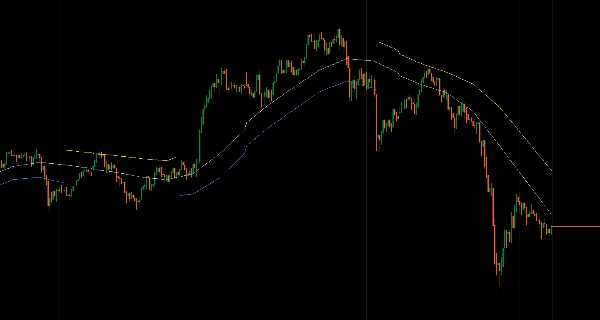
Sistem saluran adaptif tiga warna menggunakan rata-rata bergerak pada keempat harga OHLC untuk arah tren dan analisis struktur.
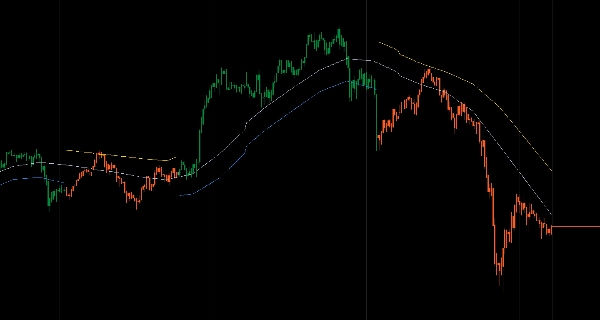
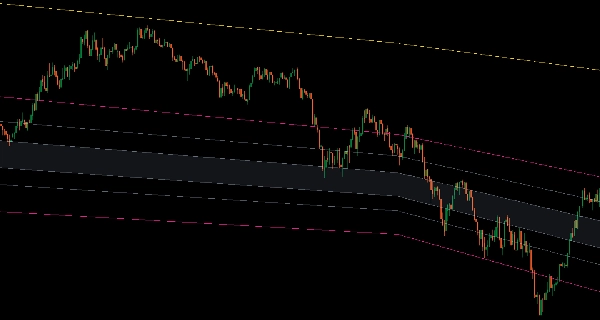
Menampilkan batas Tinggi/Rendah, garis bias arah Buka/Tutup, dan keseimbangan Median dengan status tren berwarna (Biru tren naik, Emas tren turun, Abu-abu netral) yang beradaptasi bersama.
Dua mode tampilan (saluran penuh atau pengurangan kekacauan berbasis tren), enam zona Fibonacci opsional (retracement saluran penuh, level setengah saluran, ekstensi breakout), 15 algoritma rata-rata bergerak (Arnaud Legoux, Jurik, Hull, KAMA, VIDYA, Deviation Scaled, SuperSmoother, Ultimate Smoother, McGinley Dynamic, T3, ZLEMA, Laguerre), interpolasi multi-timeframe, perhitungan tanggal jangkar untuk periode pertumbuhan berbasis peristiwa, dan pewarnaan bar berbasis tren memberikan struktur saluran yang kohesif bagi trader yang menargetkan pullback dan mean reversion dalam batas yang ditentukan.
FITUR
Sistem Tren Tiga Warna
- Garis biru: Tren naik terkonfirmasi—perdagangkan pullback ke garis bawah
- Garis emas: Tren turun terkonfirmasi—perdagangkan pantulan ke garis atas
- Garis abu-abu: Netral/rentang—hindari ekstrem, scalp di tengah
- Semua garis beradaptasi bersama—tidak ada sinyal campuran
Struktur Saluran Lengkap
- Garis Tinggi/Rendah mendefinisikan batas saluran
- Garis Buka/Tutup menunjukkan bias arah dalam saluran
- Garis Median (tengah dari keempatnya) menandai keseimbangan sejati
- Struktur terintegrasi yang bergerak secara kohesif
Dua Mode Tampilan
- Mode Saluran: Selalu tampilkan kedua batas dengan warna tren
- Mode Berbasis Tren: Sembunyikan garis atas pada tren naik, garis bawah pada tren turun—mengurangi kekacauan visual, menjaga fokus pada batas yang dapat diperdagangkan
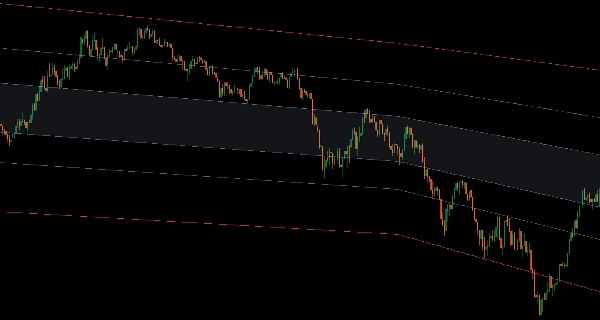
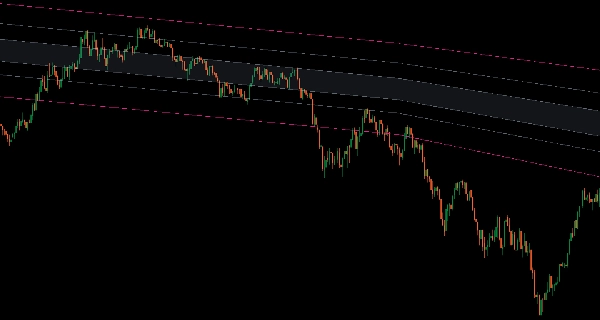
6 Zona Fibonacci (Opsional)
- Antara Rendah-Tinggi (retracement saluran penuh)
- Antara Rendah-Median atau Median-Tinggi (level setengah saluran)
- Ekstensi atas/bawah (target breakout)
- Rentang total (dari ekstensi bawah ke atas)
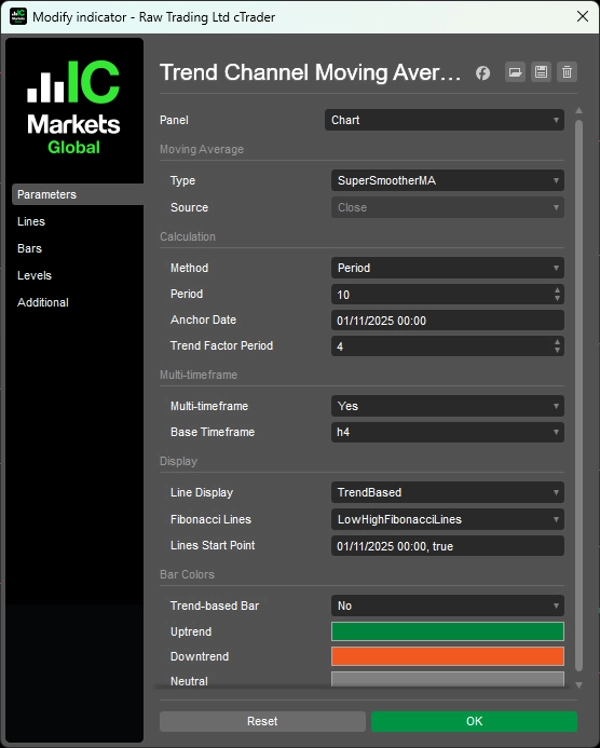
15 Jenis Rata-Rata Bergerak
- Algoritma profesional: Arnaud Legoux, Jurik, Hull, KAMA, VIDYA, Deviation Scaled, SuperSmoother, Ultimate Smoother, McGinley Dynamic, T3, ZLEMA, Laguerre
- Sinyal bersih yang dioptimalkan untuk identifikasi tren
Fungsi Lanjutan
- Mode multi-timeframe dengan interpolasi halus
- Perhitungan tanggal jangkar (periode pertumbuhan dari peristiwa/level tertentu)
- Pewarnaan bar berbasis tren (opsional)
- Kontrol titik awal garis (sembunyikan data historis, tampilkan hanya struktur terbaru)
__________________________________________________________________________________________
INDIKATOR GRATIS LAINNYA
Jelajahi berbagai alat analisis pasar—dari struktur dan volume hingga regresi, volatilitas, dan timeframe kustom.
Kode sumber tersedia di repository GitHub.
Semua gratis untuk digunakan. Tetapi jika Anda ingin memberikan dukungan kopi, Anda dapat mengarahkannya di sini.
Support/Resistance
Volume
- Volume Activity Profiler
- Volume Efficiency Analyzer
- Volume Profile Analytics
- Volume Profile - Updated
- Volume Spread Analysis
- VWAP (Volume Weighted Average Price)
Rata-Rata Bergerak
- SSL Channel
- Anchored Moving Average
- Deviation-Scaled Moving Average
- Gann High Low Activator
- Instantaneous Trendline
- Kaufman Adaptive MA with Trend Vision
- Moving Average Channel
- Moving Averages Suite
- Trend Channel Moving Average
Utilitas/Kustom
Berbasis Regresi
Volatilitas
Osilator
__________________________________________________________________________________________
PENOLAKAN
Perdagangan melibatkan risiko. Indikator ini dimaksudkan hanya untuk analisis teknis — selalu terapkan manajemen risiko yang tepat dan berdagang dengan bertanggung jawab.
MASUKAN & PENINGKATAN
Jika Anda memiliki saran, permintaan fitur, atau ide untuk peningkatan, silakan tinggalkan komentar di tab Diskusi. Masukan Anda membantu meningkatkan indikator untuk semua orang.
Ringkasan
Key features include two display modes—full channel and trend-based clutter reduction—and six optional Fibonacci zones covering full and half-channel retracements plus breakout extensions. The system supports 15 professional moving average algorithms such as Arnaud Legoux, Jurik, Hull, KAMA, VIDYA, and others, optimized for clean trend identification. Additional functionalities include multi-timeframe interpolation, anchor date calculation for event-based periods, trend-based bar coloring, and control over line start points to focus on recent data.
This indicator is designed to help traders identify pullbacks and mean reversion opportunities within defined channel boundaries, enhancing decision-making in various market conditions.
Ulasan pelanggan
5 | 100 % | |
4 | 0 % | |
3 | 0 % | |
2 | 0 % | |
1 | 0 % |


