
Deskripsi
RINGKASAN
Dasar: Prinsip Wyckoff
Indikator ini dibangun berdasarkan dua konsep pelengkap dari metodologi Wyckoff:
1. Usaha vs Hasil
Prinsip inti Wyckoff menyatakan bahwa pergerakan harga (hasil) harus sebanding dengan volume di baliknya (usaha). Ketika usaha dan hasil selaras, pasar berperilaku normal. Ketika keduanya menyimpang, itu menandakan potensi titik balik atau kekuatan kelanjutan.
Indikator ini langsung mengimplementasikan hal ini melalui metrik Efisiensi (hasil per unit usaha) dan inversnya, Absorpsi (usaha yang tidak menghasilkan hasil).
2. Analisis Rentang
Wyckoff juga menekankan analisis karakter batang harga individu—memeriksa rentang (spread), posisi penutupan harga dalam rentang tersebut, dan apakah batang menunjukkan komitmen atau ketidakpastian.
Indikator ini mengimplementasikan analisis rentang melalui Keyakinan (komitmen arah), Rasio Terbuang (retracement dalam batang), dan Posisi Penutupan (digunakan untuk mengontekstualisasikan absorpsi sebagai akumulasi atau distribusi).
APA YANG DILAKUKAN INDIKATOR INI
Volume Activity Profiler menganalisis batang harga dari kerangka waktu yang dipilih dan memecah aktivitasnya menjadi komponen yang dapat diukur. Ini menghitung metrik mentah dan metrik berbasis persentil yang diturunkan, kemudian menampilkannya sebagai grafik batang horizontal yang ditempatkan di bawah setiap batang yang dianalisis.
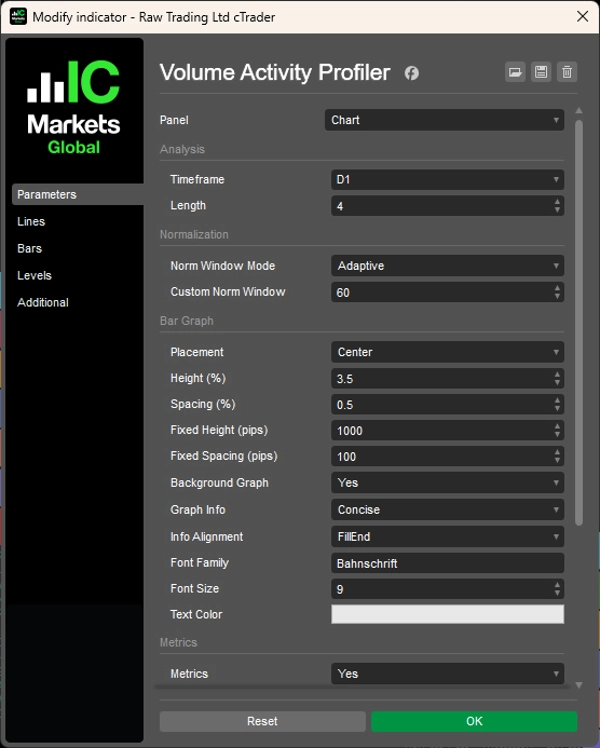
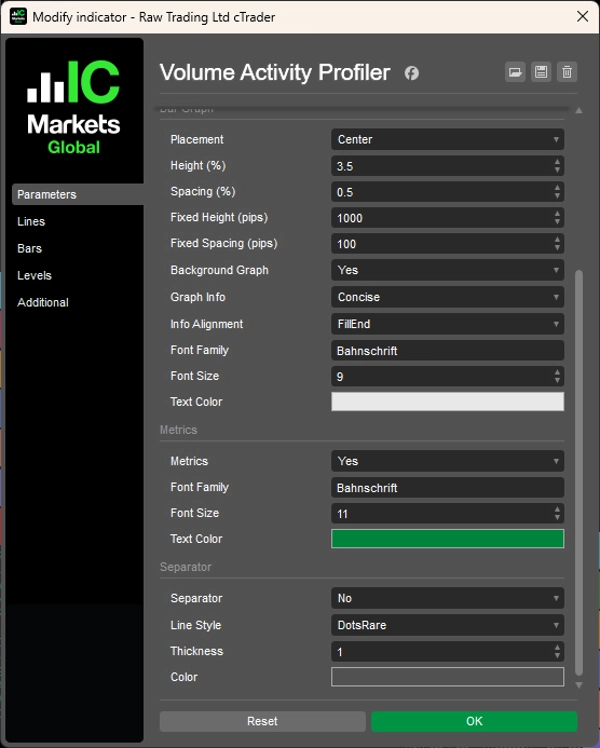
Anda mengonfigurasi dua parameter utama:
- Kerangka Waktu: Kerangka waktu untuk dianalisis (misalnya, Mingguan, Harian, H4)
- Panjang: Berapa banyak batang yang akan diprofil (misalnya, 4 batang terakhir)
Indikator kemudian memprofil setiap batang dalam cakupan tersebut, menghitung metrik dan memberi peringkat terhadap satu sama lain serta terhadap norma historis.
PENJELASAN METRIK
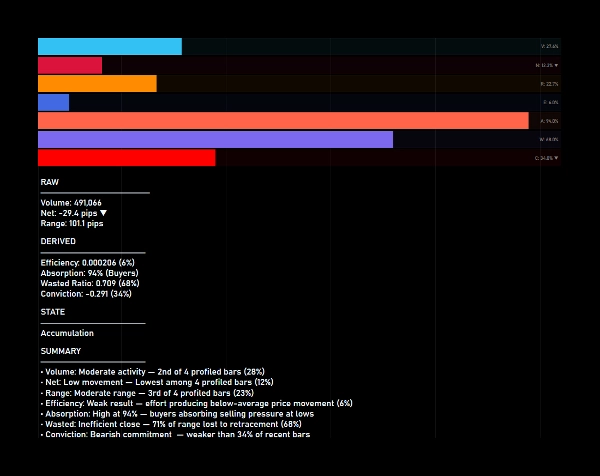
Metrik Mentah (berdasarkan proporsi di antara batang yang diprofil):
1. Volume
Volume tick dari batang. Menunjukkan proporsi dari total volume yang diprofil yang diwakili oleh batang ini.
2. Bersih
Pergerakan arah (tutup − buka) dalam pips. Menunjukkan proporsi dari total pergerakan bersih. Warna menunjukkan arah (hijau = bullish, merah = bearish).
3. Rentang
Total rentang harga (tinggi − rendah) dalam pips. Menunjukkan proporsi dari total rentang di antara batang yang diprofil.
Metrik Turunan (berbasis persentil terhadap jendela historis):
1. Efisiensi (Usaha vs Hasil)
Rentang yang dihasilkan per unit volume. Efisiensi tinggi berarti usaha diterjemahkan menjadi pergerakan harga. Efisiensi rendah menunjukkan absorpsi atau resistensi.
2. Absorpsi (Usaha vs Hasil)
Invers dari efisiensi. Absorpsi tinggi menunjukkan volume diserap tanpa pergerakan harga yang sebanding—potensi akumulasi atau distribusi.
3. Terbuang (Analisis Rentang)
Persentase rentang yang hilang karena retracement (rentang − bersih) / rentang. Pemborosan tinggi berarti batang mengembalikan sebagian besar pergerakannya. Pemborosan rendah menunjukkan batang yang bersih dan arah jelas.
4. Keyakinan (Analisis Rentang)
Komitmen arah yang diukur sebagai bersih/rentang. Keyakinan tinggi berarti batang ditutup dekat ekstremnya. Keyakinan rendah menunjukkan ketidakpastian atau penolakan.
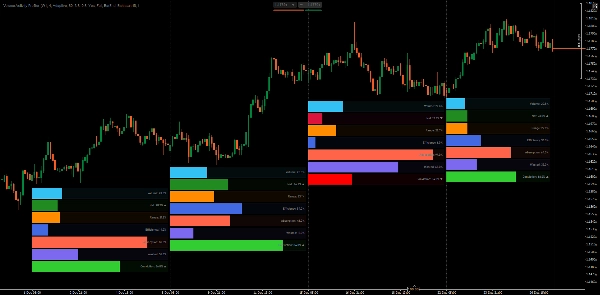
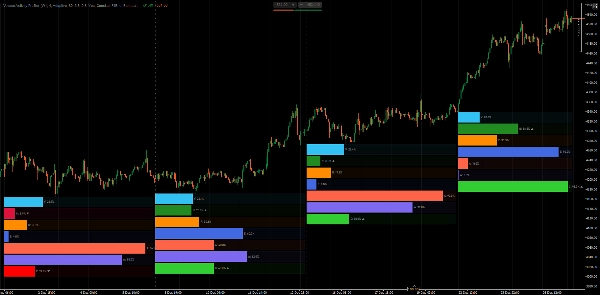
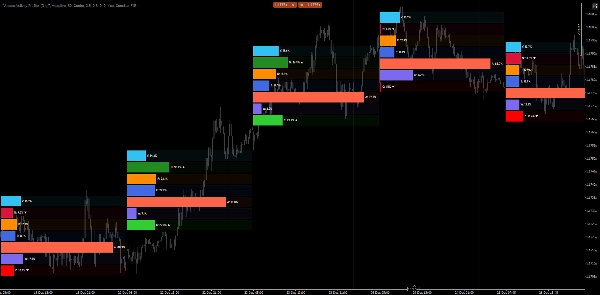
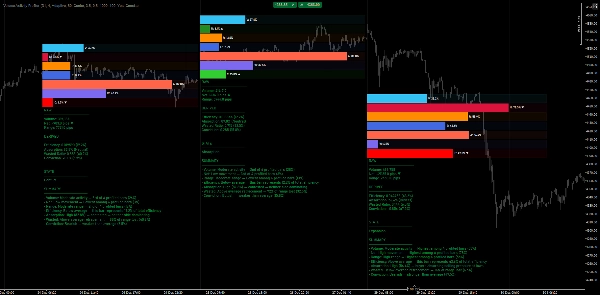
MEMAHAMI GRAFIK BATANG
Setiap batang yang diprofil menampilkan 7 batang horizontal:
- Volume, Bersih, Rentang — Diisi berdasarkan proporsi di antara batang yang diprofil
- Efisiensi, Absorpsi, Terbuang, Keyakinan — Diisi berdasarkan peringkat persentil terhadap data historis
Batang yang terisi hingga 80% pada Efisiensi berarti efisiensi batang ini lebih tinggi daripada 80% batang dalam jendela normalisasi.
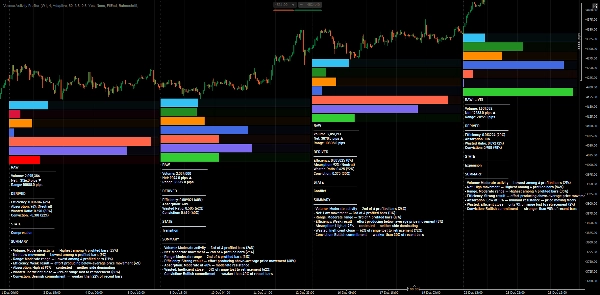
KLASIFIKASI STATUS AKTIVITAS
Saat tampilan Metrik diaktifkan, indikator mengklasifikasikan setiap batang ke dalam salah satu status berikut:
1. Kompresi
Efisiensi rendah + keyakinan rendah — harga menggulung, potensi energi membangun
2. Ekspansi
Efisiensi tinggi + keyakinan tinggi + pemborosan rendah — pergerakan arah yang kuat
3. Konflik
Pemborosan tinggi + keyakinan rendah — pertarungan antara pembeli dan penjual
4. Akumulasi
Absorpsi tinggi + penutupan dekat titik terendah — pembeli menyerap tekanan jual
5. Distribusi
Absorpsi tinggi + penutupan dekat titik tertinggi — penjual menyerap tekanan beli
6. Penolakan
Keyakinan tinggi tetapi penutupan berlawanan arah — pergerakan gagal, potensi pembalikan
7. Transisi
Sinyal campuran — pasar dalam transisi antar status
MANFAAT PRAKTIS
- Penilaian cepat usaha vs hasil — Langsung lihat apakah volume menghasilkan pergerakan proporsional atau diserap.
- Analisis struktur multi-kerangka waktu — Analisis batang kerangka waktu lebih tinggi sambil tetap berada pada kerangka waktu eksekusi Anda.
- Identifikasi akumulasi/distribusi — Absorpsi tinggi dengan posisi penutupan mengungkapkan di mana pemain besar mungkin aktif.
- Deteksi kelelahan dan penolakan — Keyakinan tinggi dengan posisi penutupan berlawanan memperingatkan potensi pembalikan.
- Bandingkan batang secara objektif — Peringkat dan persentil menghilangkan subjektivitas dari penilaian volume "tinggi" atau "rendah".
- Konfirmasi breakout — Status ekspansi dengan efisiensi dan keyakinan tinggi mengonfirmasi minat breakout yang nyata.
VOLUME TICK SEBAGAI PROXY USAHA
Indikator ini menggunakan volume tick sebagai input usaha. Dalam forex, volume tick mewakili frekuensi perubahan harga daripada volume perdagangan aktual—sebuah keterbatasan yang diketahui dari pasar terdesentralisasi.
Meskipun demikian, volume tick secara efektif berfungsi sebagai proxy usaha karena:
- Ini mencerminkan aktivitas pasar relatif antar batang
- Jumlah tick yang tinggi menunjukkan keterlibatan peserta yang meningkat
- Hubungan usaha vs hasil tetap berlaku—aktivitas tinggi yang menghasilkan sedikit pergerakan tetap menandakan absorpsi
Peringkat persentil dan perbandingan batang indikator tetap valid selama data konsisten.
CATATAN
- Indikator menggunakan jendela normalisasi adaptif berdasarkan kerangka waktu saat diatur ke mode Adaptif, memastikan konteks historis yang relevan.
- Perhitungan persentil hanya diperbarui pada batang yang selesai untuk menghindari pembacaan tidak stabil pada batang yang sedang terbentuk.
- Batang yang sedang terbentuk saat ini ditandai dengan [LIVE] di panel metrik.
__________________________________________________________________________________________
INDIKATOR GRATIS LAINNYA
Jelajahi berbagai alat analisis pasar—dari struktur dan volume hingga regresi, volatilitas, dan kerangka waktu khusus.
Kode sumber tersedia di repositori GitHub repository.
Semua gratis untuk digunakan. Tetapi jika Anda ingin memberikan dukungan kopi, Anda dapat mengarahkannya di sini.
Support/Resistance
Volume
- Volume Activity Profiler
- Volume Efficiency Analyzer
- Volume Profile Analytics
- Volume Profile - Updated
- Volume Spread Analysis
- VWAP (Volume Weighted Average Price)
Moving Averages
- SSL Channel
- Anchored Moving Average
- Deviation-Scaled Moving Average
- Gann High Low Activator
- Instantaneous Trendline
- Kaufman Adaptive MA with Trend Vision
- Moving Average Channel
- Moving Averages Suite
- Trend Channel Moving Average
Utilities/Custom
Regression-Based
Volatility
Oscillators
__________________________________________________________________________________________
PENAFIAN
Perdagangan melibatkan risiko. Indikator ini dimaksudkan hanya untuk analisis teknis — selalu terapkan manajemen risiko yang tepat dan berdagang dengan bertanggung jawab.
MASUKAN & PENINGKATAN
Jika Anda memiliki saran, permintaan fitur, atau ide untuk peningkatan, silakan tinggalkan komentar di tab Diskusi. Masukan Anda membantu meningkatkan indikator untuk semua orang.
Ringkasan
The indicator profiles price bars over a user-selected timeframe and length, calculating raw metrics such as Volume (tick volume proportion), Net (directional price movement), and Range (price range). It also derives percentile-based metrics including Efficiency (price movement per volume unit), Absorption (volume without proportional price change), Wasted Ratio (retracement within the bar), and Conviction (directional commitment).
These metrics are visually represented as horizontal bar graphs beneath each analyzed bar, facilitating objective comparison and historical context. The indicator classifies bars into activity states like Compression, Expansion, Conflict, Accumulation, Distribution, Rejection, and Transition, aiding in identifying market phases and potential turning points.
Volume Activity Profiler uses tick volume as an effort proxy, reflecting relative market activity. It supports multi-timeframe analysis and updates percentile rankings on completed bars to ensure stable readings. This tool assists traders in assessing volume efficiency, spotting accumulation/distribution, confirming breakouts, and understanding market structure through quantitative volume and price bar analysis.
Ulasan pelanggan
5 | 100 % | |
4 | 0 % | |
3 | 0 % | |
2 | 0 % | |
1 | 0 % |


