
الوصف
نظرة عامة
خط الاتجاه اللحظي هو مؤشر فني طوره جون إهليرز، مهندس كهربائي طبق مبادئ معالجة الإشارة الرقمية (DSP) على تحليل الأسواق المالية. نُشر في الأصل في مجلة الأسهم والسلع (فبراير 2002) وتم تفصيله في كتبه "علوم الصواريخ للمتداولين" و "التحليل السيبراني للأسهم والعقود الآجلة"، يعزل هذا المؤشر مكون الاتجاه في بيانات السعر عن طريق تصفية المكونات الدورية (المتذبذبة).
المفهوم
على عكس المتوسطات المتحركة التقليدية التي تقوم فقط بتنعيم بيانات السعر، يستخدم خط الاتجاه اللحظي تقنيات رياضية مشتقة من الهندسة الكهربائية لتفكيك حركة السعر إلى مكونين مميزين:
- مكون الاتجاه - الانحياز الاتجاهي للسوق
- مكون الدورة - التقلبات المتذبذبة حول الاتجاه
من خلال تطبيق مرشحات النوتش ومنهجية تحويل هيلبرت، أنشأ إهليرز مؤشراً يستجيب بسرعة للتغيرات الحقيقية في الاتجاه مع تصفية الضوضاء والدورات قصيرة الأجل. النتيجة هي خط اتجاه يتكيف مع ظروف السوق مع تأخير أقل بكثير مقارنة بالمتوسطات المتحركة البسيطة أو الأسية لنفس الفترات.
الميزة الأساسية لهذا النهج هي الدقة الرياضية في فصل ما هو "اتجاه" عما هو "ضوضاء الدورة"، بدلاً من مجرد حساب متوسط السعر على فترة زمنية ثابتة.
كيف يعمل
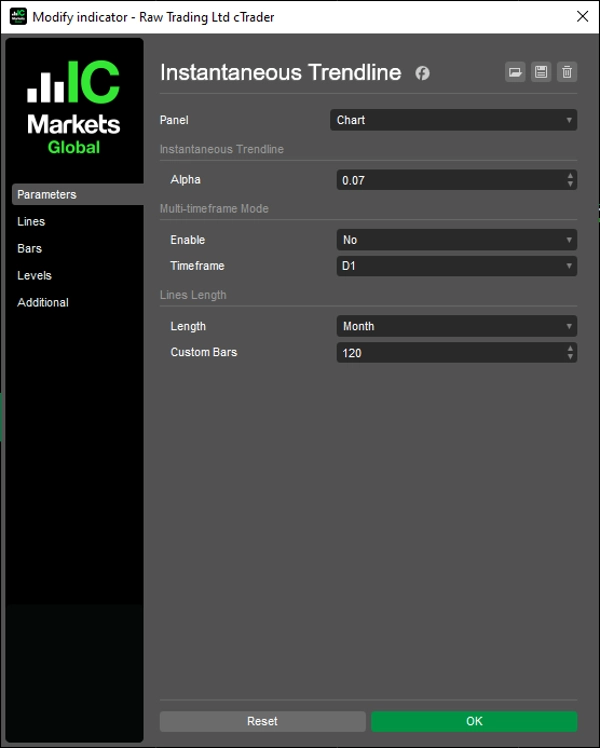
يحسب المؤشر خط اتجاه مملس باستخدام صيغة تكرارية تعتمد على معامل ألفا. تتضمن الصيغة:
- بيانات السعر الحالية والحديثة (منتصف HL/2)
- قيم خط الاتجاه السابقة
- معامل تنعيم ألفا (الافتراضي 0.07)
كما يولد المؤشر خط الزناد، وهو خط الاتجاه اللحظي مزاح بمقدار شريطين. يستخدم هذا الخط الزناد لتوليد إشارات التداول من خلال منطق التقاطع.
التفسير
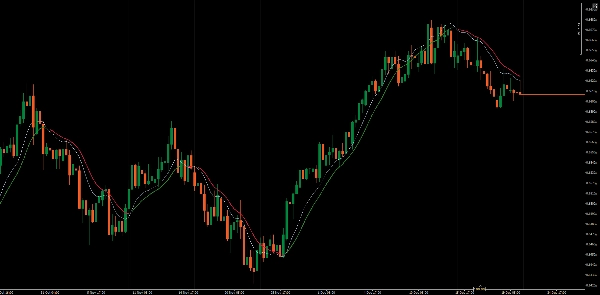
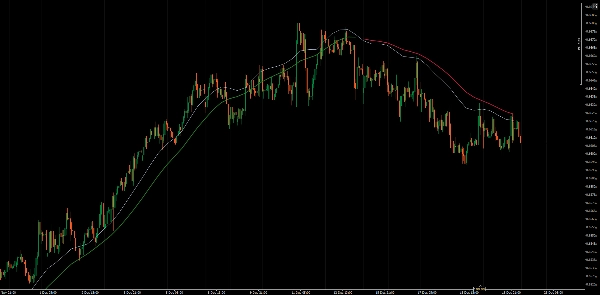
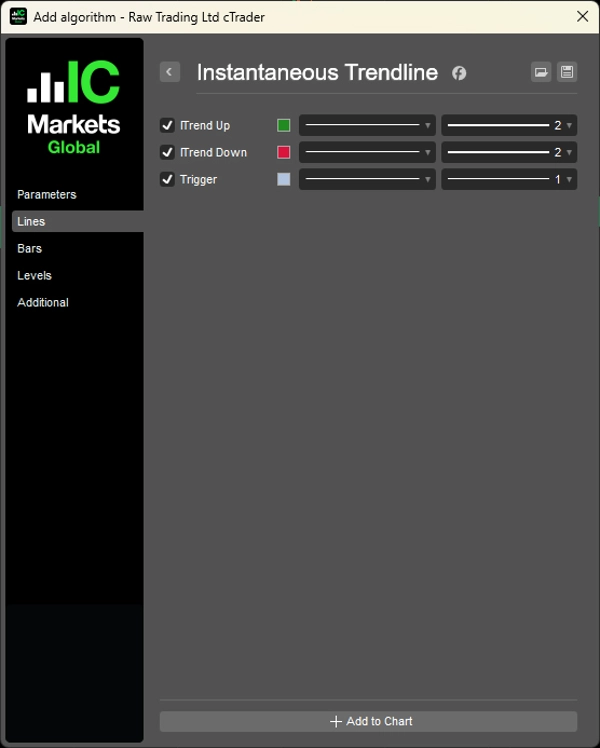
يرسم المؤشر ثلاثة خطوط:
- ITrend صاعد: يظهر عندما يكون الزناد > ITrend، مما يشير إلى ظروف صاعدة
- ITrend هابط: يظهر عندما يكون الزناد < ITrend، مما يشير إلى ظروف هابطة
- الزناد: النسخة المؤجلة بمقدار شريطين من خط الاتجاه
توليد الإشارات:
- إشارة صاعدة: عندما يتقاطع خط الزناد فوق خط الاتجاه اللحظي
- إشارة هابطة: عندما يتقاطع خط الزناد تحت خط الاتجاه اللحظي
العرض الملون يسهل التعرف على اتجاه الاتجاه الحالي بنظرة سريعة.
المعلمات الرئيسية
ألفا (0.01 - 1.0، الافتراضي 0.07)
تتحكم في تنعيم واستجابة خط الاتجاه. القيم الأقل تنتج خطوط اتجاه أكثر نعومة وأبطأ استجابة مناسبة للاتجاهات طويلة الأجل. القيم الأعلى تزيد الحساسية لتغيرات السعر لكنها قد تولد إشارات خاطئة أكثر في الأسواق المتقلبة. القيمة الافتراضية 0.07 توازن بين الاستجابة وتصفية الضوضاء.
طول الخطوط (الافتراضي 120)
يحدد عدد الأشرطة من بيانات خط الاتجاه التاريخية المعروضة على الرسم البياني. يساعد ذلك في الحفاظ على نظافة الرسم مع توفير سياق كافٍ.
القيود
- مثل جميع أدوات تتبع الاتجاه، يمكن أن ينتج خط الاتجاه اللحظي إشارات خاطئة في الأسواق الجانبية والمتذبذبة
- خلال الاتجاهات القوية، قد يبقيك المؤشر في الاتجاه لفترة أطول، لكن قد تفوت القمة أو القاع الدقيقة
- تختلف الأداء بشكل كبير حسب ظروف السوق (اتجاهي مقابل جانبي)
- المؤشر تفاعلي، وليس تنبؤي - يحدد الاتجاهات بعد أن تبدأ
__________________________________________________________________________________________
مزيد من المؤشرات المجانية
استكشف مجموعة واسعة من أدوات تحليل السوق — من الهيكل والحجم إلى الانحدار والتقلب والأطر الزمنية المخصصة.
رمز المصدر متاح على مستودع GitHub.
جميعها مجانية للاستخدام. ولكن إذا رغبت في دعم القهوة، يمكنك توجيه الدعم من هنا.
الدعم/المقاومة
الحجم
- محلل نشاط الحجم
- محلل كفاءة الحجم
- تحليلات ملف الحجم
- ملف الحجم - محدث
- تحليل انتشار الحجم
- VWAP (متوسط السعر المرجح بالحجم)
المتوسطات المتحركة
- قناة SSL
- المتوسط المتحرك المثبت
- المتوسط المتحرك بمقياس الانحراف
- مفعّل جان العالي والمنخفض
- خط الاتجاه اللحظي
- متوسط كوفمان التكيفي مع رؤية الاتجاه
- قناة المتوسط المتحرك
- مجموعة المتوسطات المتحركة
- متوسط قناة الاتجاه
الأدوات المساعدة/المخصصة
المبني على الانحدار
التقلب
المذبذبات
__________________________________________________________________________________________
إخلاء المسؤولية
التداول ينطوي على مخاطر. هذا المؤشر مخصص للتحليل الفني فقط — دائماً طبق إدارة مخاطر مناسبة وتداول بمسؤولية.
التعليقات والتحسينات
إذا كانت لديك اقتراحات أو طلبات ميزات أو أفكار للتحسين، يرجى ترك تعليق في تبويب النقاش. تساعد ملاحظاتك في تحسين المؤشر للجميع.
الملخص
تقييمات العملاء
5 | 100 % | |
4 | 0 % | |
3 | 0 % | |
2 | 0 % | |
1 | 0 % |


![شعار "[Stellar Strategies] Inside Bar with Signals"](https://cdn.ctrader.com/image/webp/1d9e8bfa-3b2c-4440-bb37-5856902008a7_30683)


