
Deskripsi
RINGKASAN
Volume Spread Analysis (VSA) adalah metodologi yang dikembangkan oleh Tom Williams, mantan trader sindikat, berdasarkan karya Richard Wyckoff dari awal 1900-an. VSA menginterpretasikan hubungan antara volume, rentang harga (spread), dan lokasi penutupan untuk mengidentifikasi ketidakseimbangan penawaran dan permintaan.
Konsep Utama VSA:
- Volume menunjukkan jumlah aktivitas - siapa yang berpartisipasi
- Spread menunjukkan volatilitas dan ketidakpastian - seberapa jauh harga bergerak
- Lokasi Penutupan menunjukkan siapa yang menang pada bar - pembeli atau penjual
- Konteks menunjukkan di mana kita berada dalam siklus pasar - fase kekuatan atau kelemahan
Ketika volume meningkat dengan spread lebar tetapi sedikit kemajuan harga, ini menunjukkan absorpsi (satu pihak menyerap tekanan pihak lain). Ketika volume menurun dengan spread sempit dalam tren, ini menunjukkan kurangnya partisipasi (potensi kelemahan).
Implementasi Ini:
Indikator ini mengkuantifikasi konsep VSA menggunakan metode statistik. Ini berbeda dari VSA tradisional dalam beberapa hal:
- Menggunakan
(close - open) / rangesebagai metrik efisiensi (tidak ada dalam VSA asli) - Pola absorpsi mengidentifikasi "satu pihak menang" daripada "absorpsi tekanan" tradisional
- ENR (Effort No Result) dikualifikasi menggunakan ambang efisiensi; VSA asli lebih interpretatif
- Menggunakan rata-rata trimmed mean untuk volume (tahan outlier) dan peringkat persentil untuk spread
- Tidak termasuk: Volume Penghentian, Upthrust, Test, pola Shakeout
Ini adalah pendekatan kuantitatif dan algoritmik terhadap konsep VSA. VSA tradisional lebih interpretatif dan bergantung pada konteks. Gunakan indikator ini sebagai salah satu alat analisis di antara banyak, bukan sebagai sinyal tunggal.
APA YANG DILAKUKAN INDIKATOR INI
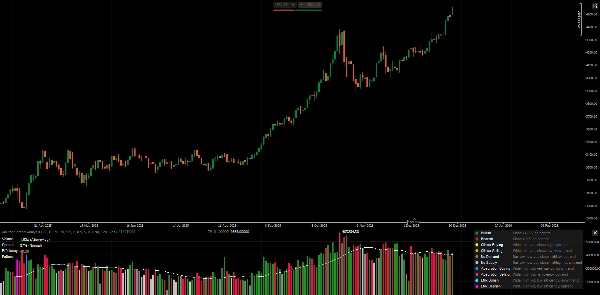
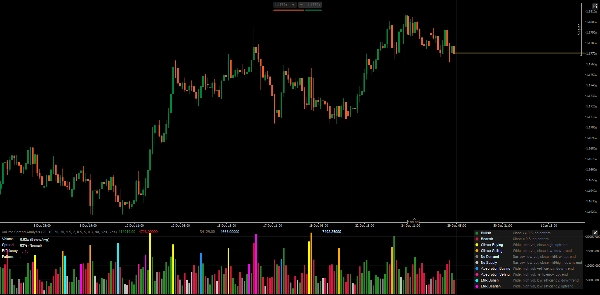
Menganalisis volume, spread, dan lokasi penutupan setiap bar untuk mendeteksi potensi ketidakseimbangan penawaran/permintaan. Menampilkan histogram volume yang diwarnai berdasarkan jenis pola, dengan panel metrik waktu nyata.
DEFINISI POLA
1. Bar Standar (Tanpa Pola)
- Bullish: Penutupan ≥ 0,5 dalam rentang, tidak ada pola khusus terdeteksi
- Bearish: Penutupan < 0,5 dalam rentang, tidak ada pola khusus terdeteksi
2. Pola Klimaks (Potensi Keletihan)
- Klimaks Pembelian: Spread lebar + volume sangat tinggi + penutupan tinggi + dalam tren naik
-
- Interpretasi: Kemungkinan keletihan pembelian, waspadai pembalikan
- Klimaks Penjualan: Spread lebar + volume sangat tinggi + penutupan rendah + dalam tren turun
-
- Interpretasi: Kemungkinan keletihan penjualan, waspadai pembalikan
3. Pola Lemah (Kurangnya Keyakinan)
- Tidak Ada Permintaan: Spread sempit + volume rendah + penutupan tengah/rendah + dalam tren naik
-
- Interpretasi: Pembeli tidak mendukung reli, potensi kelemahan
- Tidak Ada Penawaran: Spread sempit + volume rendah + penutupan tengah/tinggi + dalam tren turun
-
- Interpretasi: Penjual tidak mendorong harga lebih rendah, potensi kekuatan
4. Pola Absorpsi (Satu Pihak Menang)
- Absorpsi Pembelian: Spread lebar + volume tinggi + efisiensi positif + dalam tren turun
-
- Interpretasi: Pembeli menyerap tekanan penjualan, potensi pembalikan naik
- Absorpsi Penjualan: Spread lebar + volume tinggi + efisiensi negatif + dalam tren naik
-
- Interpretasi: Penjual menyerap tekanan pembelian, potensi pembalikan turun
5. Pola ENR (Usaha Tanpa Hasil Jelas)
- ENR Bullish: Spread lebar + volume tinggi + efisiensi rendah + dalam tren turun
-
- Interpretasi: Usaha tinggi tapi tidak ada pemenang jelas, potensi dukungan/ketidakpastian
- ENR Bearish: Spread lebar + volume tinggi + efisiensi rendah + dalam tren naik
-
- Interpretasi: Usaha tinggi tapi tidak ada pemenang jelas, potensi resistensi/ketidakpastian
PENJELASAN PANEL METRIK
Volume
- Menunjukkan volume bar saat ini sebagai rasio terhadap trimmed mean (misal, "1.85x")
- Klasifikasi: Rendah / Di Bawah Rata-rata / Di Atas Rata-rata / Tinggi / Sangat Tinggi
- Volume tinggi = partisipasi pasar, tapi konteks penting
Spread
- Menunjukkan peringkat persentil (0-100%) relatif terhadap bar-bar terbaru
- Klasifikasi: Sempit / Normal / Lebar
- Spread lebar = volatilitas/ketidakpastian, tidak selalu arah
Efisiensi
- Rumus:
(close - open) / (high - low) - Rentang: -1,0 sampai +1,0
- Positif = badan bullish mendominasi rentang
- Negatif = badan bearish mendominasi rentang
- Dekat nol = badan kecil, sumbu tinggi, ketidakpastian
Pola
- Pola terdeteksi saat ini (atau "-" jika tidak ada)
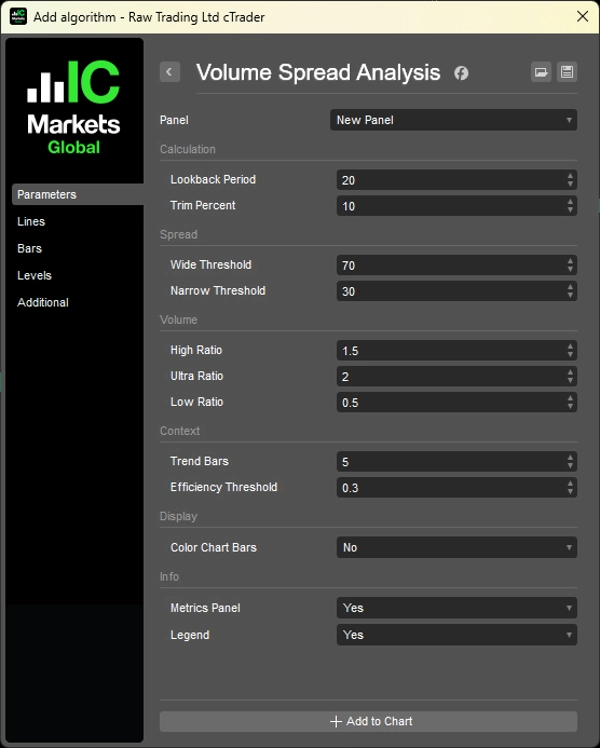
PARAMETER
1. Perhitungan
- Periode Lookback (20): Bar yang digunakan untuk statistik volume/spread
- Persentase Trim (10%): Menghapus outlier dari perhitungan volume
2. Klasifikasi Spread
- Ambang Lebar (70%): Persentil untuk mengklasifikasikan sebagai "lebar"
- Ambang Sempit (30%): Persentil untuk mengklasifikasikan sebagai "sempit"
3. Klasifikasi Volume
- Rasio Tinggi (1,5x): Ambang di atas rata-rata
- Rasio Ultra (2,0x): Ambang sangat tinggi
- Rasio Rendah (0,5x): Ambang di bawah rata-rata
4. Konteks
- Bar Tren (5): Bar ke belakang untuk membandingkan arah tren
- Ambang Efisiensi (0,3): Minimum untuk efisiensi "kuat"
5. Tampilan
- Warna Bar Grafik: Terapkan warna pola ke grafik harga
- Panel Metrik: Tampilkan metrik waktu nyata
- Legenda: Tampilkan panduan referensi pola
CARA MENGGUNAKAN
1. Jangan gunakan pola sebagai sinyal perdagangan langsung - mereka menunjukkan potensi konteks, bukan entri.
2. Gabungkan dengan struktur harga - VSA bekerja terbaik untuk mengonfirmasi apa yang ditunjukkan struktur harga.
3. Perhatikan konteks - pola yang sama dapat berarti hal berbeda di support vs resistance.
4. Perspektif volume penting - absorpsi volume tinggi di level kunci > absorpsi bar acak.
Keterbatasan Volume Forex
Pasar spot forex menunjukkan volume tick (jumlah perubahan harga), bukan kontrak yang benar-benar diperdagangkan. Pola mungkin kurang dapat diandalkan dibandingkan dengan futures/saham yang memiliki data volume asli.
LEGENDA (Referensi Bawaan)
Aktifkan parameter "Legenda" untuk menampilkan deskripsi pola langsung di grafik.
__________________________________________________________________________________________
INDIKATOR GRATIS LAINNYA
Jelajahi berbagai alat analisis pasar—dari struktur dan volume hingga regresi, volatilitas, dan kerangka waktu khusus.
Kode sumber tersedia di repositori GitHub repository.
Semua gratis untuk digunakan. Tetapi jika Anda ingin memberikan dukungan kopi, Anda dapat mengarahkannya di sini.
Support/Resistance
Volume
- Volume Activity Profiler
- Volume Efficiency Analyzer
- Volume Profile Analytics
- Volume Profile - Updated
- Volume Spread Analysis
- VWAP (Volume Weighted Average Price)
Moving Averages
- SSL Channel
- Anchored Moving Average
- Deviation-Scaled Moving Average
- Gann High Low Activator
- Instantaneous Trendline
- Kaufman Adaptive MA with Trend Vision
- Moving Average Channel
- Moving Averages Suite
- Trend Channel Moving Average
Utilities/Custom
Regression-Based
Volatilitas
Osilator
__________________________________________________________________________________________
PENYANGKALAN
Perdagangan melibatkan risiko. Indikator ini dimaksudkan hanya untuk analisis teknis — selalu terapkan manajemen risiko yang tepat dan berdagang dengan bertanggung jawab.
MASUKAN & PENINGKATAN
Jika Anda memiliki saran, permintaan fitur, atau ide untuk peningkatan, silakan tinggalkan komentar di tab Diskusi. Masukan Anda membantu meningkatkan indikator untuk semua orang.
Ringkasan
This implementation quantifies VSA concepts using statistical methods, including an efficiency metric defined as (close - open) / range, trimmed mean volume averaging, and percentile ranking for spread. It identifies several bar patterns: Standard (bullish/bearish), Climax (buying/selling exhaustion), Weak (No Demand/No Supply), Absorption (one side winning), and ENR (Effort No Result), each indicating different market conditions.
The indicator displays a volume histogram colored by detected pattern type and provides a real-time metrics panel showing volume ratio, spread percentile, efficiency, and current pattern. Parameters allow customization of lookback periods, volume/spread thresholds, and display options such as coloring chart bars and showing a pattern legend.
VSA is applicable across markets including Forex, stocks, indices, commodities, and crypto. Note that Forex volume reflects tick volume, which may affect pattern reliability. The indicator is designed as an analytical tool to complement price structure analysis rather than as standalone trade signals.
Ulasan pelanggan
5 | 100 % | |
4 | 0 % | |
3 | 0 % | |
2 | 0 % | |
1 | 0 % |


![Logo "[Hamster-Coder] Bollinger Bands"](https://cdn.ctrader.com/image/webp/21d8e5d6-fb11-4bac-b9ee-cd05c2b76804_30327)


