present
Registrati e ricevi uno sconto da $50 sul tuo primo acquisto
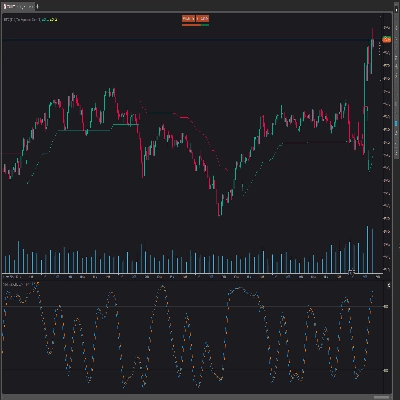
Trading product for Machine Learning Momentum Index Indicatore Indices AI, image 1
Machine Learning Momentum Index
4.5
Recensioni: 2
2
Vendite
7.3K
Installazioni gratuite

Descrizione

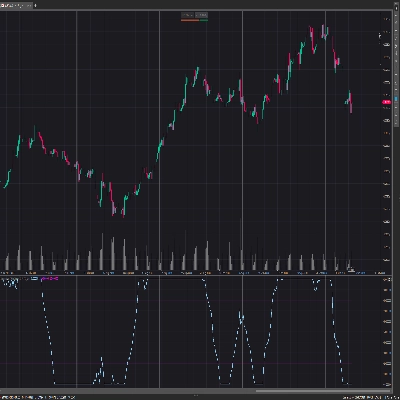
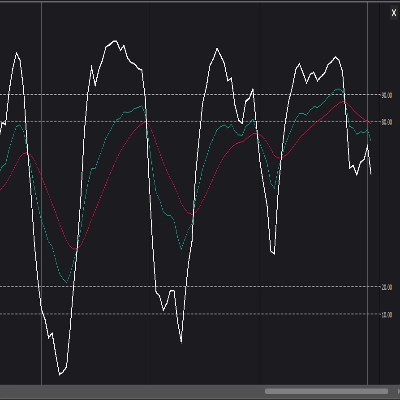
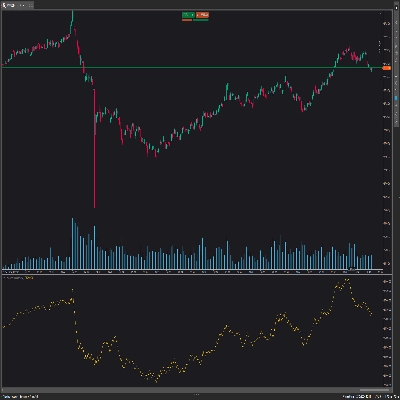
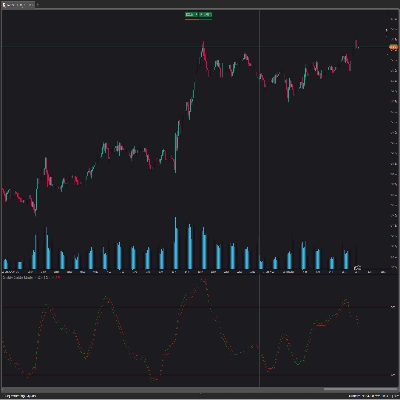
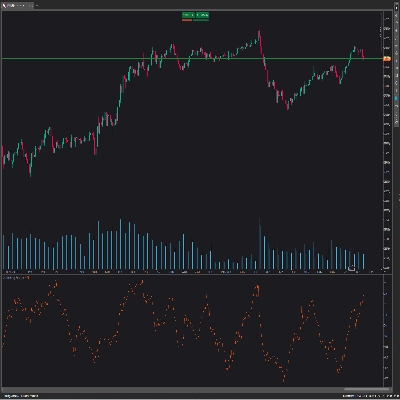
L'Indice di Momentum del Machine Learning (MLMI) rappresenta il passo successivo nel trading con oscillatori. Combinando l'analisi tradizionale del momentum con il machine learning, MLMI offre uno strumento potente e dinamico che si adatta alle complessità degli scenari finanziari moderni. Offrendo ai trader un modo adattivo per comprendere e agire sul momentum e sulle tendenze di mercato, questo oscillatore fornisce approfondimenti in tempo reale sul momentum di mercato e sulle tendenze prevalenti

Riepilogo

Riepilogo AI
The Machine Learning Momentum Index (MLMI) is an advanced oscillator that integrates traditional momentum analysis with machine learning techniques. Designed to provide real-time insights, MLMI helps traders assess market momentum and identify prevailing trends dynamically. By adapting to the complexities of modern financial markets, this indicator offers an enhanced approach to momentum trading. It is applicable across various indices, including Nasdaq, S&P 500, DAX, and Dow, supporting traders in making informed decisions based on evolving market conditions.
Profilo indicatore

Discussioni

Recensioni dei clienti

4.5
Recensioni: 2
5
50 %
4
50 %
3
0 %
2
0 %
1
0 %
Recensioni dei clienti
July 9, 2025
Pros: Combines RSI-based WMAs and k‑NN machine learning for adaptive momentum detection. Highlights trend changes and consolidation zones. Cons: No alerts or tooltips. Less effective on higher timeframes. Requires other confirmation tools to trade reliably.
April 26, 2025
Accuracy

Domande frequenti

Indices
AI
I prodotti disponibili tramite cTrader Store, inclusi bot di trading, indicatori e plugin, sono forniti da sviluppatori terzi e resi disponibili esclusivamente a scopo informativo e di accesso tecnico. cTrader Store non è un broker e non fornisce consulenze in materia di investimento, raccomandazioni individualizzate o garanzie di risultati futuri.

Altro da questo autore
Logo di "PMAX"
5.0
(6)
Gratis
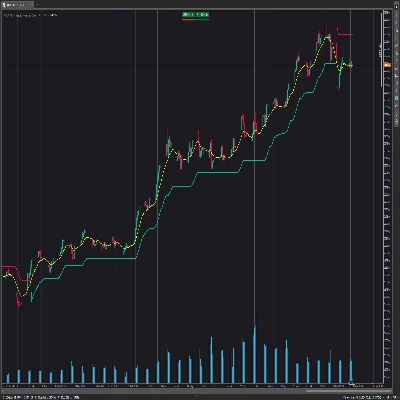
It's a combination of two trailing stop loss and the other one is well-known ATR-based SuperTrend.
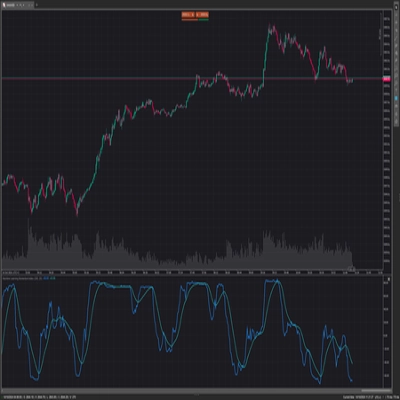
Stochastic RSI (StochRSI) is a technical indicator used to measure the strength and weakness of the RSI.
Laguerre RSI is based on John EHLERS' Laguerre Filter to avoid the noise of RSI.
The KDJ oscillator display consists of 3 lines (K, D and J - hence the name of the display) and 2 levels.
The Darvas Box involves identifying "boxes" or trading ranges where a stock's price consolidates before breaking out.
On Balance Volume (OBV) measures buying and selling pressure as a cumulative indicator.
The Ichimoku Cloud is a comprehensive technical analysis system developed by Japanese journalist Goichi Hosoda
The QQE (Quantitative Qualitative Estimation) Weighted Oscillator improves its original version by weighting the RSI.
Chaikin money flow's primary purpose is to distinguish between periods of accumulation and distribution of a security.

Potrebbe interessarti anche

🚀📈 Plot buy/sell signals on Range Bars using Moving Averages and RSI. Clear, actionable trading insights.🚀📈
🚀 QQEX Trinity Indicator - The Ultimate Trading Filter 🚀
Bolliger Bands + Hamster-Coder™ Timeframe Decoupling
[Stellar Strategies] BOS Trend: Premium multi-timeframe BOS indicator for precision trend analysis.📈📉
Multi-symbol Inside Bar Scanner with dashboard & breakout alerts
This indicator displays the OrderBlocks of the current and higher timeframe, made by ICT's student.
Laser entries with pivot confirmation. No repaint, all timeframes. Professional results.
PRO Liquidity Sweep + FVG Combo detector with custom Gold/Blue signals & alerts
Detects valid Fair Value Gaps from strong 3-bar patterns. Keep drawing unfilled gaps until price fills them.
EMA cross filtered by a trend average and its ATR channel, with long, short and close marks and colored candles.
Advanced market structure and institutional cycle mapper with visual reference cards and entry alerts
Order Block PRO — Smart Institutional Zone Detector
Real-Time Candlestick Pattern Detection with Custom Alerts & Trend Analysis for cTrader
Stop drawing levels manually. SmartLevels Pro detects, scores & predicts — H4/H1/M15 · cTrader
Bollinger Bands Width
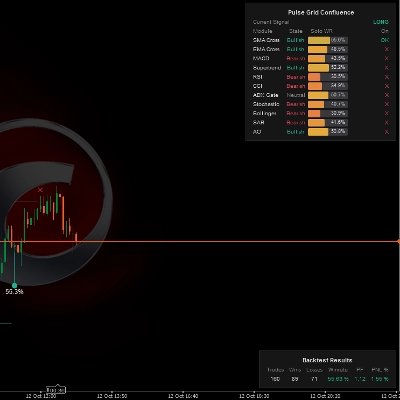
Multi-indicator confluence HUD & real-time backtest engine to detect trend alignment and filter high-probability setups.
Instantly spot high-liquidity institutional moves with clean, non-obtrusive triangle alerts on cTrader charts.
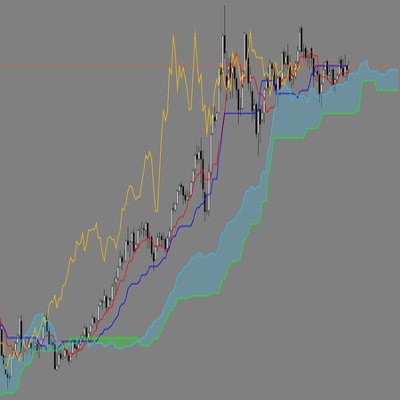
Ichimoku Kinkō Hyō with fixed shift to 25 as Ctrader calculate it from 0 and values was wrong for Chikou Span and Kumo.

Prezzo

2
Vendite
7.3K
Installazioni gratuite