
Description
Structure de la plage d'ouverture sur n'importe quelle période — des sessions intrajournalières aux cycles annuels — avec niveaux de Fibonacci et projections d'extension.
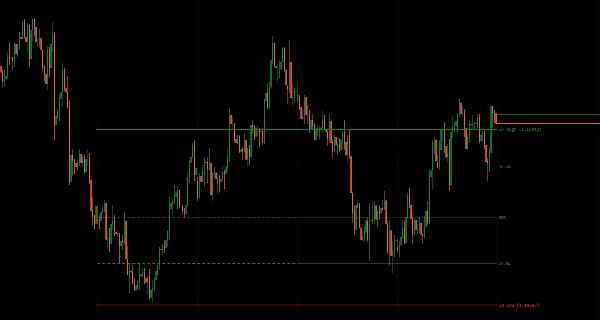
Marque la plage Haut/Bas établie pendant les périodes d'ouverture (quotidienne, hebdomadaire, mensuelle, trimestrielle, annuelle ou plage personnalisée) comme référence pour les cassures, la réversion à la moyenne et les attentes de volatilité.
Huit types de périodes avec détection de session sensible au fuseau horaire (Sydney/Tokyo/Londres/NY), décalage historique pour comparaison multi-périodes, sept niveaux de Fibonacci optionnels (11,4 % à 88,6 %) à l'intérieur de la plage IB, projections ascendantes/descendantes à partir des limites, contrôle flexible de l'extension des lignes (période IB uniquement, barre actuelle ou N périodes en avant), et détection précise des périodes fournissent une analyse complète de la plage d'ouverture pour les traders ciblant des configurations basées sur la structure sur tous les horizons temporels.
FONCTIONNALITÉS
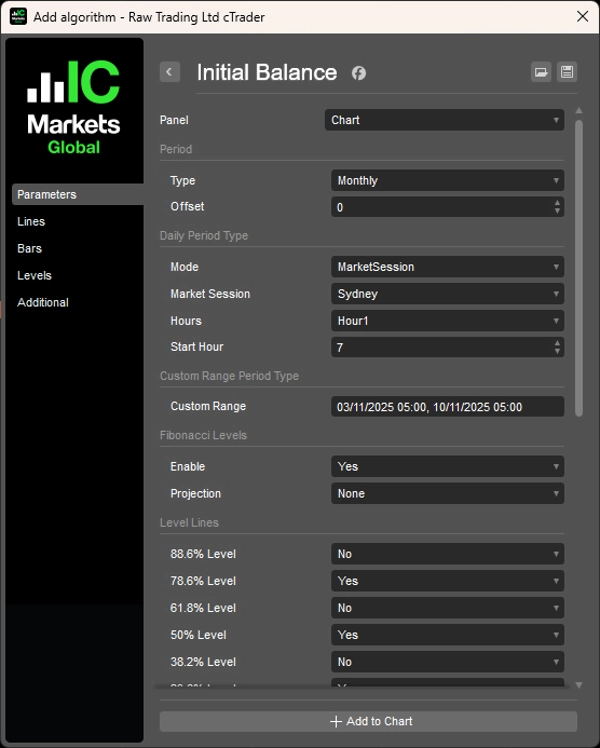
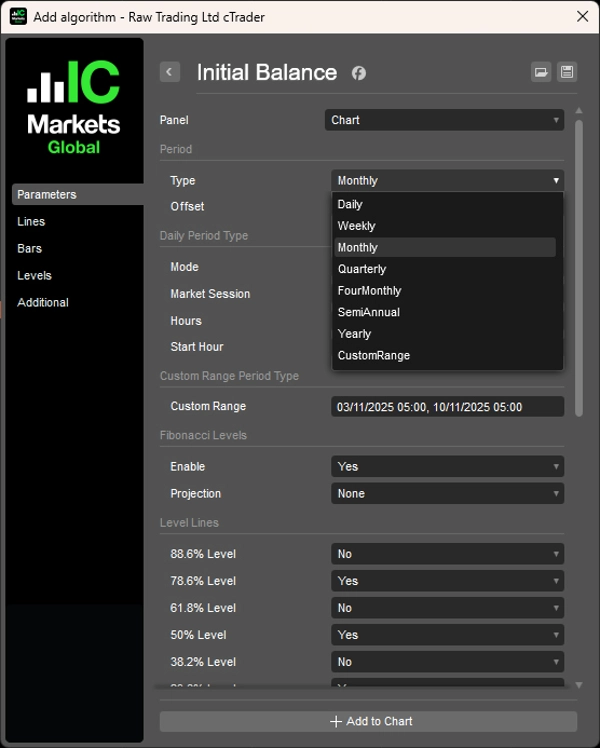
8 Types de Périodes
- Quotidienne, Hebdomadaire, Mensuelle, Trimestrielle, 4 mois, Semestrielle, Annuelle, Plage personnalisée
- Modes quotidiens : basés sur les heures (1-12 heures) ou session de marché (Sydney/Tokyo/Londres/NY)
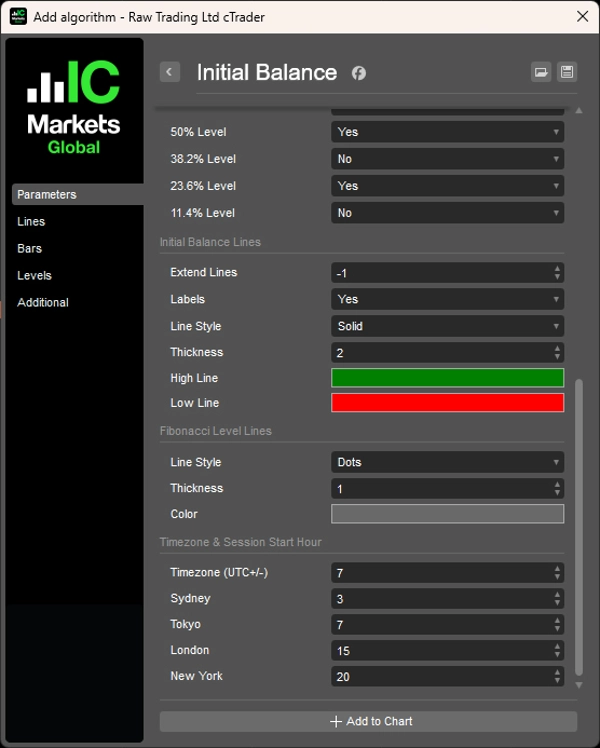
- Heures de début de session configurables avec ajustement du décalage UTC sensible au fuseau horaire
- Plage personnalisée : définir la date/heure exacte de début/fin pour une analyse basée sur un événement
Périodes Historiques
- Paramètre de décalage pour voir les plages IB passées (par exemple, IB de la semaine dernière, IB du mois dernier)
- Comparer l'action des prix actuelle avec les structures des périodes précédentes
- Analyse multi-périodes pour confirmation de tendance
Niveaux de Fibonacci
- 7 niveaux optionnels (11,4 %, 23,6 %, 38,2 %, 50 %, 61,8 %, 78,6 %, 88,6 %) à l'intérieur de la plage IB
- Zones de réversion à la moyenne à l'intérieur de l'équilibre
- Points de référence précis pour l'entrée/sortie
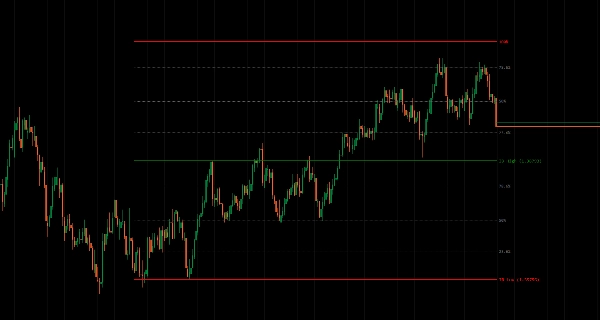
Projections de Fibonacci
- Projeter les niveaux vers le haut/le bas à partir du haut/bas IB
- Objectifs potentiels de cassure au-delà de la plage
- Zones d'extension pour les mouvements directionnels
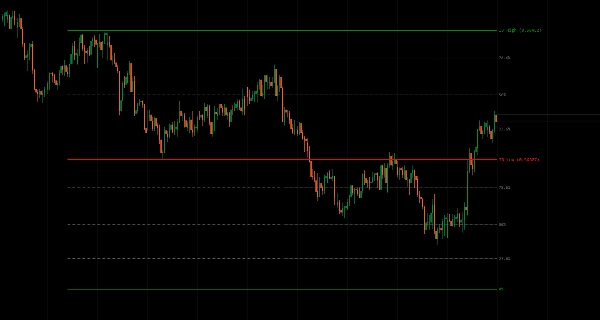
Contrôle de l'Extension des Lignes
- Période IB uniquement : afficher la plage pendant la période de formation
- Barre actuelle : étendre jusqu'au présent
- N périodes en avant : projeter dans le futur pour la planification
- Gestion visuelle propre
Détection Précise des Périodes
- Calcul précis de la plage d'ouverture pour chaque type de période
- Sensible au fuseau horaire pour les marchés mondiaux
- Gère proprement les chevauchements et transitions de session
__________________________________________________________________________________________
PLUS D'INDICATEURS GRATUITS
Explorez une large gamme d'outils d'analyse de marché — de la structure et du volume à la régression, la volatilité et les horizons temporels personnalisés.
Le code source est disponible sur le dépôt GitHub.
Tous gratuits à utiliser. Mais si vous souhaitez offrir un café en soutien, vous pouvez le faire ici.
Support/Résistance
Volume
- Profileur d'Activité de Volume
- Analyseur d'Efficacité du Volume
- Analyse du Profil de Volume
- Profil de Volume - Mis à jour
- Analyse de Répartition du Volume
- VWAP (Prix Moyen Pondéré par le Volume)
Moyennes Mobiles
- Canal SSL
- Moyenne Mobile Ancrée
- Moyenne Mobile Échelonnée par Déviation
- Activateur Haut Bas de Gann
- Ligne de Tendance Instantanée
- Moyenne Mobile Adaptative de Kaufman avec Vision de Tendance
- Canal de Moyenne Mobile
- Suite de Moyennes Mobiles
- Moyenne Mobile du Canal de Tendance
Utilitaires/Personnalisé
Basé sur la Régression
Volatilité
Oscillateurs
__________________________________________________________________________________________
AVERTISSEMENT
Le trading comporte des risques. Cet indicateur est destiné uniquement à l'analyse technique — appliquez toujours une gestion des risques appropriée et tradez de manière responsable.
RETROACTION & AMÉLIORATIONS
Si vous avez des suggestions, des demandes de fonctionnalités ou des idées d'amélioration, veuillez laisser un commentaire dans l'onglet Discussion. Vos retours aident à améliorer l'indicateur pour tous.
Résumé
Key features include configurable session start times with UTC offset adjustments, historical offset parameters for comparing past initial balance ranges, and multi-period analysis for trend confirmation. It offers optional Fibonacci retracement levels (11.4% to 88.6%) within the initial balance range to highlight mean reversion zones and precise entry or exit points. Additionally, Fibonacci projections extend upward or downward from the initial balance boundaries to indicate potential breakout targets and directional extension zones.
Line extension controls allow users to display the range during its formation, extend it to the current bar, or project it forward for planning purposes. The indicator ensures precise period detection, handling session overlaps and transitions accurately for global market analysis. This tool aids traders in identifying breakout, mean reversion, and volatility expectations based on opening range structures across all timeframes.
Avis clients
5 | 50 % | |
4 | 50 % | |
3 | 0 % | |
2 | 0 % | |
1 | 0 % |


