
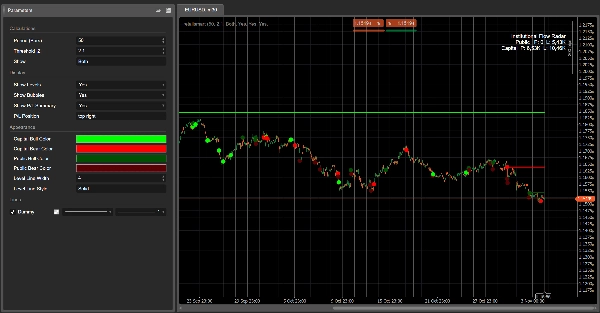
Institutional Flow Radar
Indikator
3 pembelian
Versi 1.0, Nov 2025
Windows, Mac
4.3
Ulasan: 3
Deskripsi
Institutional Flow Radar – Deskripsi
Konsep:
Institutional Flow Radar memindai grafik untuk peristiwa volume abnormal dan mengklasifikasikannya menjadi dua kelompok:
- Modal → aktivitas yang dikaitkan dengan peserta yang lebih kuat / lebih berpengetahuan
- Publik → aktivitas yang dikaitkan dengan kerumunan yang lebih luas
Kemudian:
- menggambar level horizontal pada peristiwa tersebut,
- menandai peristiwa yang paling relevan dengan gelembung berwarna,
- dan menampilkan ringkasan P/L yang membandingkan berapa banyak volume Modal vs Publik yang saat ini dalam keuntungan atau kerugian.
Sekilas, Anda dapat melihat di mana volume besar terjadi, siapa yang menang, dan harga mana yang masih bertahan.
Cara kerjanya (versi singkat)
- Untuk setiap bar, algoritma menghitung Z-score volume selama N bar terakhir (Periode).
- Jika nilai absolut Z-score melebihi Ambang Batas |Z| Anda, bar tersebut ditandai sebagai peristiwa volume.
- Struktur candle (badan vs rentang total) digunakan untuk mengklasifikasikan peristiwa:
-
- badan kecil, sumbu panjang → Modal (absorpsi / perilaku lebih kompleks)
- badan besar, pergerakan arah → Publik (breakout gaya kerumunan / pengejaran)
- Sebuah level horizontal digambar pada harga peristiwa dan dipertahankan sampai harga melewati level tersebut dengan jelas (mitigasi).
- Untuk setiap level aktif, Radar memeriksa apakah harga saat ini:
-
- menguntungkan untuk sisi tersebut (harga bergerak sesuai arah peristiwa), atau
- merugi (harga bergerak berlawanan).
- Kotak ringkasan P/L menggabungkan volume dari semua level aktif:
-
- Keuntungan Modal vs Kerugian Modal
- Keuntungan Publik vs Kerugian Publik
Elemen visual
- Level Modal:
-
- Peristiwa naik → level Modal bullish (misal hijau cerah / aqua)
- Peristiwa turun → level Modal bearish (misal merah cerah)
- Level Publik:
-
- Peristiwa naik → level Publik bullish (nada abu-abu)
- Peristiwa turun → level Publik bearish (abu-abu lebih gelap / arang)
- Gelembung:
-
- Lingkaran pada peristiwa paling signifikan, diwarnai berdasarkan:
-
- arah (bullish/bearish)
- kelas (Modal / Publik)
- Kotak Ringkasan P/L:
-
- Baris: Publik, Modal
- Kolom: Keuntungan, Kerugian
- Intensitas latar belakang sel meningkat sesuai volume yang bersangkutan.
Label parameter yang disarankan (Bahasa Inggris)
- Periode (Bar): jumlah bar yang digunakan untuk menghitung Z-score volume.
- Ambang Batas |Z|: nilai absolut minimum Z-score untuk menandai sebuah peristiwa.
- Tampilkan:
Modal,Publik, atauKeduanya– kelas mana yang akan ditampilkan. - Tampilkan Level / Tampilkan Gelembung / Tampilkan Ringkasan P/L
- Warna Bull Modal / Warna Bear Modal
- Warna Bull Publik / Warna Bear Publik
- Lebar Garis Rata-rata / Gaya Garis Rata-rata
Ringkasan
Ringkasan AI
Institutional Flow Radar is a trading indicator that identifies and classifies abnormal volume events on price charts into two categories: Capital (activity from stronger or more informed participants) and Public (activity from the broader crowd). It calculates a volume Z-score for each bar over a specified period and flags bars exceeding a set threshold as volume events. These events are further classified based on candle structure—smaller bodies with long wicks indicate Capital activity, while larger bodies with directional moves indicate Public activity.
The indicator visually marks these events by drawing horizontal levels at event prices, which remain until price moves decisively through them. Significant events are highlighted with colored bubbles indicating direction (bullish or bearish) and classification (Capital or Public). A P/L summary box aggregates volume at active levels, showing Capital and Public volumes currently in profit or loss.
Users can customize parameters such as the period for Z-score calculation, threshold for event detection, and visual settings including colors for bullish and bearish levels for both Capital and Public groups. This tool provides a consolidated view of where large volume occurred, which participant group is prevailing, and which price levels are holding, aiding in volume-based breakout analysis.
Profil indikator
Ulasan pelanggan
4.3
Ulasan: 3
5 | 33 % | |
4 | 67 % | |
3 | 0 % | |
2 | 0 % | |
1 | 0 % |
Ulasan pelanggan
November 18, 2025
The only reason it stays interesting is the trading notes stop feeling so random, and two sessions say more than one clean chart.
November 9, 2025
Diskusi
Pertanyaan umum
Breakout
Produk-produk yang tersedia melalui cTrader Store, termasuk bot trading, indikator, dan plugin, disediakan oleh pengembang pihak ketiga serta hanya ditujukan untuk akses teknis dan informasi. cTrader Store bukan broker dan tidak menyediakan saran investasi, rekomendasi pribadi, atau jaminan apa pun tentang kinerja di masa mendatang.


![Logo "[Hamster-Coder] Bollinger Bands"](https://cdn.ctrader.com/image/webp/21d8e5d6-fb11-4bac-b9ee-cd05c2b76804_30327)


![Logo "High-Low Divergence [Iridio Capital]"](https://cdn.ctrader.com/image/webp/443c4661-7abb-40f1-842f-4b6ec560649b_40914)


Harga
42.11M
Volume trading
6.13M
Pip dimenangkan
222
Penjualan
8.39K
Instal gratis