
Deskripsi
Hitung level support dan resistance menggunakan lima metode pivot profesional di berbagai kerangka waktu.
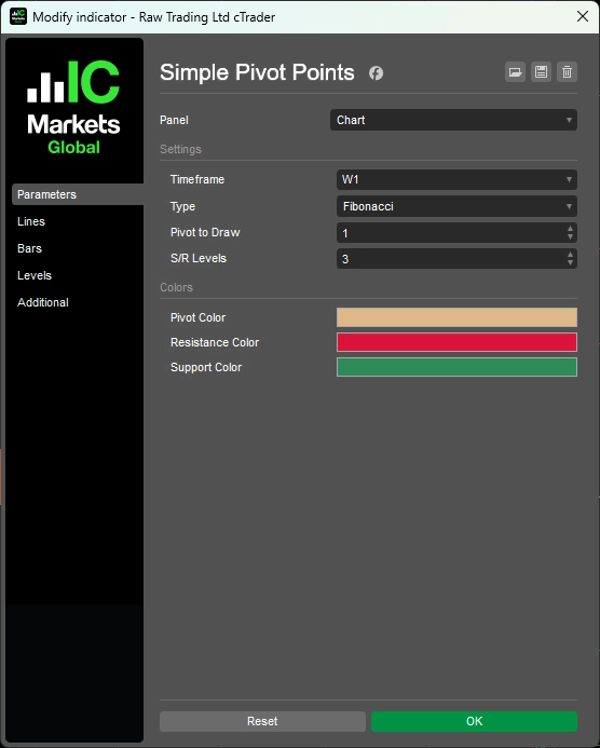
Secara otomatis menghasilkan level pivot (Standar, Fibonacci, Woodie, Camarilla, DeMark) dari data M5 hingga Bulanan dengan tampilan terbatas waktu untuk setiap periode.
Lima algoritma perhitungan dengan logika jarak S/R yang berbeda, level support/resistance yang dapat dikonfigurasi (0-6 per sisi), tampilan pivot historis untuk beberapa periode sebelumnya, garis berlabel otomatis (PP, R1-R6, S1-S6), dan visualisasi berwarna memberikan analisis pivot kelas institusional bagi trader yang menargetkan level harga kunci dan pembalikan intraday.
FITUR
Lima Metode Perhitungan
- Standar: Rumus trader lantai klasik—pivot yang paling banyak diperhatikan secara global
- Fibonacci: Menggunakan rasio Fib (38,2%, 61,8%, 100%, 138,2%, 161,8%) untuk jarak S/R
- Woodie: Memberi bobot besar pada harga penutupan—lebih responsif terhadap aksi harga terbaru
- Camarilla: Level intraday ketat menggunakan pengali 1,1/12—populer untuk scalping
- DeMark: Rumus kondisional berdasarkan hubungan penutupan vs. pembukaan—hanya 1 level S/R tapi sangat dihormati
Kustomisasi Penuh
- Kerangka waktu apa pun: Hitung dari data M5, H1, H4, Harian, Mingguan, Bulanan
- Pivot historis: Tampilkan hingga beberapa periode sebelumnya (misalnya, 3 minggu terakhir pivot)
- Level yang dapat dikonfigurasi: Tampilkan 0-6 level support/resistance per sisi
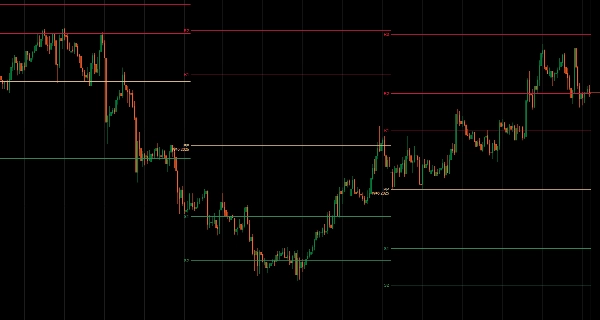
- Garis berlabel otomatis: PP, R1-R6, S1-S6 ditandai dengan jelas
- Garis terbatas waktu: Pivot setiap periode hanya ditampilkan selama durasi periode tersebut
- Berwarna: Pivot (coklat muda), Resistance (merah), Support (hijau)
__________________________________________________________________________________________
INDIKATOR GRATIS LAINNYA
Jelajahi berbagai alat analisis pasar—dari struktur dan volume hingga regresi, volatilitas, dan kerangka waktu kustom.
Kode sumber tersedia di repositori GitHub.
Semua gratis digunakan. Namun jika Anda ingin memberikan dukungan kopi, Anda dapat mengarahkannya di sini.
Support/Resistance
Volume
- Volume Activity Profiler
- Volume Efficiency Analyzer
- Volume Profile Analytics
- Volume Profile - Updated
- Volume Spread Analysis
- VWAP (Volume Weighted Average Price)
Moving Averages
- SSL Channel
- Anchored Moving Average
- Deviation-Scaled Moving Average
- Gann High Low Activator
- Instantaneous Trendline
- Kaufman Adaptive MA with Trend Vision
- Moving Average Channel
- Moving Averages Suite
- Trend Channel Moving Average
Utilities/Custom
Regression-Based
Volatility
Oscillators
__________________________________________________________________________________________
PENAFIAN
Perdagangan melibatkan risiko. Indikator ini dimaksudkan hanya untuk analisis teknikal — selalu terapkan manajemen risiko yang tepat dan berdagang dengan bertanggung jawab.
MASUKAN & PENINGKATAN
Jika Anda memiliki saran, permintaan fitur, atau ide untuk peningkatan, silakan tinggalkan komentar di tab Diskusi. Masukan Anda membantu meningkatkan indikator untuk semua orang.
Ringkasan
Ulasan pelanggan
5 | 100 % | |
4 | 0 % | |
3 | 0 % | |
2 | 0 % | |
1 | 0 % |


![Logo "Trend Angle Indicator [Iridio Capital]"](https://cdn.ctrader.com/image/webp/28a98496-3412-4fea-82eb-be3347bdd6f1_27612)


