
Deskripsi
VERSI TERBARU PROFIL VOLUME
Dibandingkan dengan versi sebelumnya, versi terbaru ini mencakup perbaikan bug penting, fitur baru, dan peningkatan kinerja yang signifikan:
Perbaikan
- Perbaikan distribusi volume: alokasi proporsional berdasarkan tumpang tindih candle, bukan 100% ke semua level yang disentuh
- Perbaikan deteksi VAH/VAL: toleransi menyesuaikan dengan tinggi level, bukan nilai tetap
- Perbaikan posisi teks: offset dinamis berdasarkan timeframe, bukan hari tetap
- Perbaikan validasi DateTime: pemeriksaan bar kosong, validasi di luar rentang
Fitur
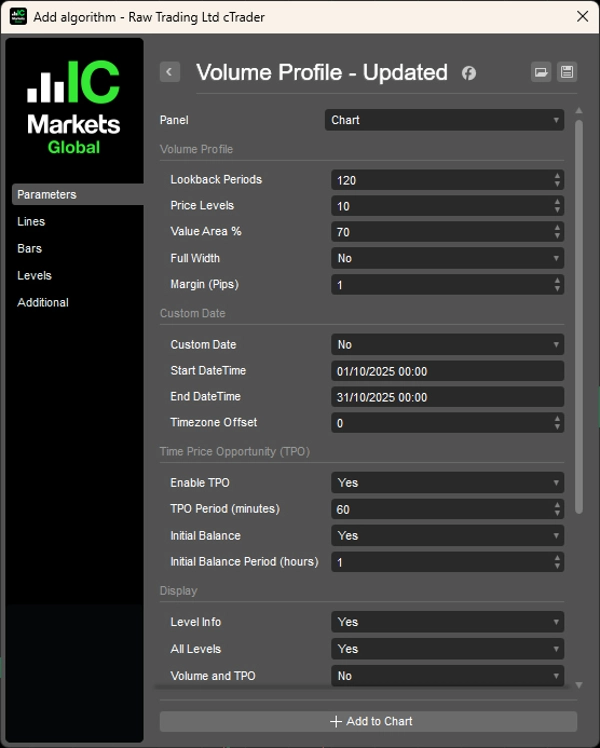
- Ditambahkan parameter Timezone Offset untuk profil DateTime
- Ditambahkan parameter Posisi Teks (Kiri/Kanan) untuk mode lookback
- Label mode DateTime sekarang mengikuti tepi bar (lebar variabel) atau sejajar di tepi profil (lebar penuh)
Kinerja
- Pencarian biner untuk pencarian indeks DateTime (sebelumnya linear O(n))
- Perhitungan total volume yang di-cache (sebelumnya dihitung ulang per level)
- Kamus TPO yang sudah diatur ukurannya untuk menghindari pengubahan ukuran
- Pola TryGetValue untuk pencarian di kamus
- Loop berbasis indeks menggantikan foreach di jalur panas
Pembersihan
- Menghapus parameter ProfileWidth (perhitungan otomatis selalu benar)
- Menyederhanakan persilangan candle menjadi satu kondisi
__________________________________________________________________________________________
CATATAN PENTING - BACA DULU
Volume Forex Bukan Volume Nyata
Volume dalam forex adalah volume tick — menghitung berapa kali harga berubah. Ini TIDAK menghitung berapa banyak uang yang diperdagangkan.
Apa yang Tidak Bisa Ditunjukkan Volume Tick
- Ukuran perdagangan. Perdagangan $100 dan $10.000.000 keduanya dihitung sebagai 1 tick.
- Aliran uang nyata. Anda tidak bisa melihat apakah uang besar atau kecil yang menggerakkan harga.
- Likuiditas sebenarnya. Anda tidak bisa melihat berapa banyak pesanan yang menunggu di pasar.
- Aktivitas bank. Bank melihat data volume nyata. Anda tidak.
Apa Artinya Ini
Volume tick hanya menunjukkan seberapa sering harga berubah — bukan uang di baliknya. Ini menimbulkan masalah:
- Anda tidak bisa melacak bank atau institusi. Mereka menggunakan data volume nyata yang tidak Anda miliki aksesnya.
- Anda tidak bisa membuktikan teori "smart money". Ide-ide itu membutuhkan volume nyata, bukan hitungan tick.
- Anda tidak bisa menilai likuiditas sebenarnya. Aktivitas tick tidak menunjukkan kedalaman order atau kekuatan pasar nyata.
- Anda tidak bisa mengukur kekuatan beli atau jual nyata. Banyak perdagangan kecil terlihat sama dengan satu perdagangan institusional besar.
- Lonjakan volume bisa menipu. Lonjakan mungkin hanya kebisingan algoritmik, bukan minat perdagangan nyata.
Cara Menggunakan Indikator Ini dengan Benar
- Anggap sebagai pengukur aktivitas, bukan pengukur uang. Volume tick tinggi = pasar sibuk. Volume tick rendah = pasar sepi. Tidak lebih dari itu.
- Bandingkan aktivitas antara waktu yang berbeda. Gunakan untuk melihat: Apakah sesi London lebih sibuk daripada New York? Apakah hari ini lebih aktif daripada kemarin? Apakah periode tren lebih sibuk daripada konsolidasi?
- Gabungkan dengan struktur harga. Gunakan support/resistance, titik ayunan, atau BOS/ChoCH bersama volume. Konteks harga mencegah sinyal palsu dari lonjakan volume yang berisik.
- Perhatikan aktivitas di level harga penting. Ketika harga menguji level kunci dan volume tick meningkat, itu berarti lebih banyak trader aktif. Ini TIDAK berarti pemain besar terlibat.
- Jangan menganggap ini menunjukkan aktivitas institusional. Volume tick tidak bisa menunjukkan akumulasi, order besar, atau "smart money." Gunakan hanya untuk mengukur ritme dan tempo.
__________________________________________________________________________________________
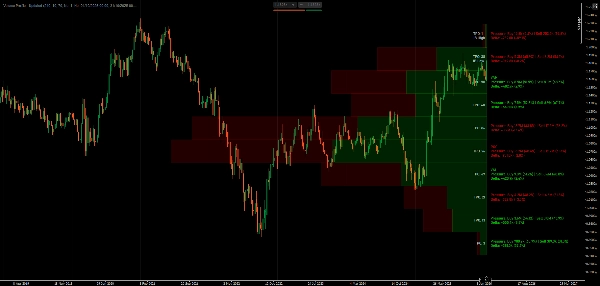
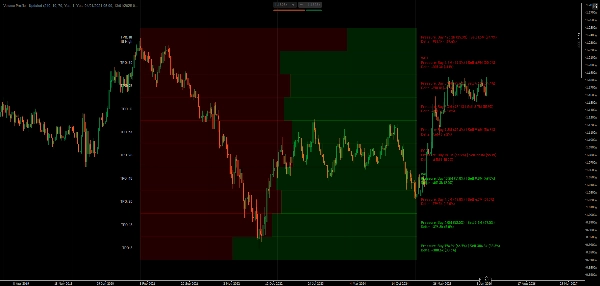
Visualisasikan distribusi volume dan waktu yang dihabiskan pada harga dengan pelacakan POC, Area Nilai, dan Market Profile TPO.
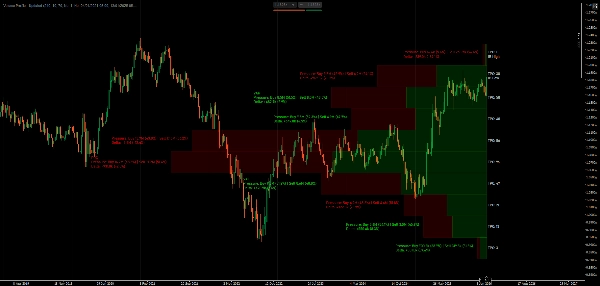
Indikator ini menunjukkan distribusi volume menggunakan konsep Market Profile. Menampilkan Titik Kontrol (level aktivitas tick tertinggi), batas Area Nilai (tempat sebagian besar perdagangan terjadi), urutan huruf TPO (waktu yang dihabiskan pada setiap harga), dan visualisasi delta yang membagi aktivitas tick berdasarkan arah candle.
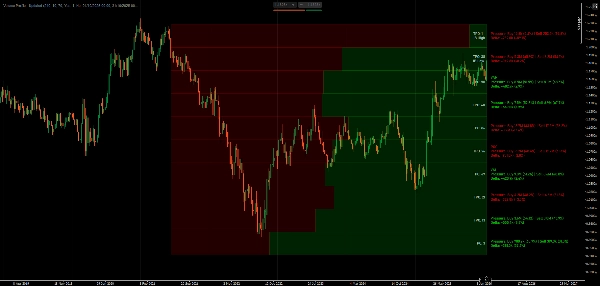
Anda dapat memilih periode lookback atau mengatur rentang tanggal tertentu, menampilkan batang volume sebagai proporsional atau lebar penuh, beralih antara semua level atau hanya level kunci, dan menyesuaikan warna untuk aktivitas bullish/bearish.
FITUR
Analisis Distribusi Volume
- Titik Kontrol (POC): Level harga dengan aktivitas tertinggi—tempat harga menghabiskan sebagian besar waktu
- Area Nilai (VA): Zona konsentrasi aktivitas yang dapat disesuaikan (default 70%)—tempat sebagian besar perdagangan terjadi
- VAH/VAL: Batas Area Nilai Tinggi/Rendah—potensi level support/resistance
- Visualisasi Delta: Batang terbagi menunjukkan arah candle pada setiap level harga
Market Profile TPO
- Pelacakan Time Price Opportunity: Menghitung berapa banyak periode waktu yang diperdagangkan pada setiap harga
- Huruf TPO: Representasi visual waktu yang dihabiskan pada harga (urutan A-Z)
- Initial Balance (IB): Rentang jam pertama—penting untuk struktur day trading
- Penanda IB High/Low: Ekstrem rentang pembukaan
Opsi Lookback Fleksibel
- Berbasis periode: Atur jumlah bar untuk dianalisis (misalnya, 120 bar terakhir)
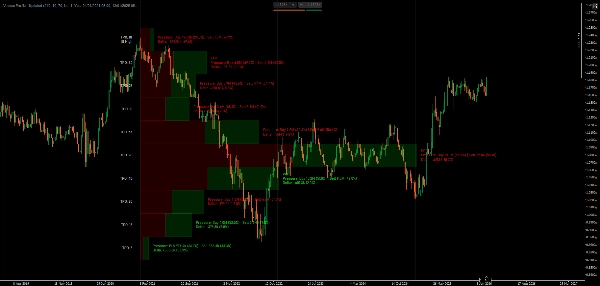
- Rentang DateTime: Menambatkan profil antara tanggal/waktu tertentu untuk analisis acara
- Lebar dinamis: Profil dengan skala otomatis atau lebar tetap
Opsi Tampilan
- Batang Volume: Lebar proporsional (skala aktivitas) atau batang seragam lebar penuh
- Pembagian arah candle dalam setiap batang
- Perhitungan delta dengan persentase
- Beralih antara semua level atau hanya level kunci (POC, VAH, VAL)
- Kontrol visibilitas detail Volume/TPO
- Rincian arah dengan persentase
- Ukuran font dan margin berbasis pip yang dapat disesuaikan
Kustomisasi Warna
- Warna independen untuk batang arah bullish/bearish
- Warna teks terpisah untuk delta positif/negatif
- Warna teks khusus TPO
Kinerja Dioptimalkan
- Pencarian waktu yang di-cache dan penggambaran persegi panjang yang efisien
- Perhitungan ulang minimal untuk kinerja lancar
- Perhitungan delta tingkat profesional berdasarkan struktur candle
__________________________________________________________________________________________
INDIKATOR GRATIS LAINNYA
Jelajahi berbagai alat analisis pasar—dari struktur dan volume hingga regresi, volatilitas, dan timeframe khusus.
Kode sumber tersedia di repository GitHub.
Semua gratis untuk digunakan. Tetapi jika Anda ingin memberikan dukungan kopi, Anda dapat mengarahkannya di sini.
Support/Resistance
Volume
- Volume Activity Profiler
- Volume Efficiency Analyzer
- Volume Profile Analytics
- Volume Profile - Updated
- Volume Spread Analysis
- VWAP (Volume Weighted Average Price)
Moving Averages
- SSL Channel
- Anchored Moving Average
- Deviation-Scaled Moving Average
- Gann High Low Activator
- Instantaneous Trendline
- Kaufman Adaptive MA with Trend Vision
- Moving Average Channel
- Moving Averages Suite
- Trend Channel Moving Average
Utilities/Custom
Regression-Based
Volatilitas
Osilator
__________________________________________________________________________________________
PENAFIAN
Perdagangan melibatkan risiko. Indikator ini dimaksudkan hanya untuk analisis teknikal — selalu terapkan manajemen risiko yang tepat dan berdagang dengan bertanggung jawab.
MASUKAN & PENINGKATAN
Jika Anda memiliki saran, permintaan fitur, atau ide untuk peningkatan, silakan tinggalkan komentar di tab Diskusi. Masukan Anda membantu meningkatkan indikator untuk semua orang.
Ringkasan
Key features include customizable lookback periods based on bar count or specific date/time ranges, dynamic or fixed profile widths, and display options for proportional or full-width volume bars. Users can toggle visibility of all levels or key levels (POC, VAH, VAL) and adjust colors independently for bullish/bearish bars and delta text. The indicator tracks Initial Balance (IB) ranges and marks IB High/Low for day trading structure.
Performance optimizations include binary search for DateTime lookups, cached volume calculations, and efficient data structures to minimize recalculations. The indicator uses tick volume, which counts price changes rather than actual traded volume, making it suitable as a market activity meter rather than a measure of real money flow or liquidity.
Supported markets include Forex, Indices, Commodities, Crypto, and Stocks. The indicator is intended for technical analysis and includes parameters for timezone offset and text positioning.
Ulasan pelanggan
5 | 100 % | |
4 | 0 % | |
3 | 0 % | |
2 | 0 % | |
1 | 0 % |


