Description
🌟 Régression Linéaire de Fibonacci🌟
L'indicateur des Bandes de Régression de Fibonacci est un outil technique avancé qui combine la puissance des lignes de régression avec les niveaux de Fibonacci pour identifier les tendances, les zones de support/résistance et les points potentiels de retournement sur les marchés financiers. 📈 Cet indicateur offre une perspective multidimensionnelle en analysant plusieurs périodes simultanément (5m, 15m, 30m et 4h), permettant aux traders de localiser avec plus de précision les zones de confluence. ⏳
🎯 Que fait l'indicateur ?
L'indicateur crée des canaux de régression basés sur les données historiques des prix et les intègre avec les niveaux de retracement de Fibonacci, fournissant une carte visuelle complète des zones clés du marché. En analysant différentes périodes, il offre une vue holistique du comportement des prix, mêlant tendances à long terme et mouvements de prix à court terme. 📊
🔍 Composants principaux
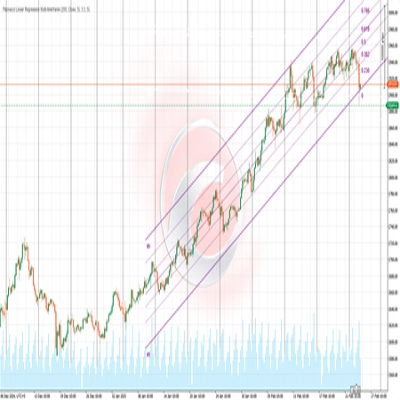
- Canaux de régression : L'indicateur calcule des lignes de régression linéaire sur une période définie par l'utilisateur (par défaut : 200 barres) pour montrer la tendance générale des prix. 📉📈
- Bandes de déviation : Des bandes supérieures et inférieures sont tracées autour de la ligne centrale de régression, représentant des déviations statistiques par rapport au prix, similaires aux Bandes de Bollinger mais basées sur la régression linéaire. 📐
- Niveaux de Fibonacci : Les niveaux classiques de Fibonacci (0, 0.236, 0.382, 0.5, 0.618, 0.786 et 1) sont tracés à l'intérieur du canal, offrant des points potentiels de rebond ou de continuation. 🔢
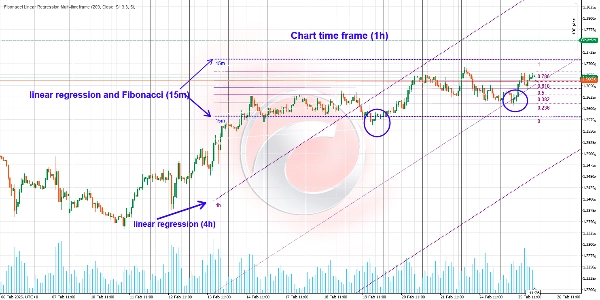
- Analyse multi-périodes : L'analyse simultanée des périodes de 5 minutes, 15 minutes, 30 minutes et 4 heures, chacune représentée par des couleurs distinctes, aide à identifier les zones où plusieurs périodes s'alignent. 🎨
🔄 Analyse multidimensionnelle du marché
Cette stratégie vous permet de voir le marché sous plusieurs angles, intégrant les tendances à long terme avec les mouvements de prix à court terme. Cette approche permet :
- D'ajuster dynamiquement les trades au fur et à mesure de l'évolution du marché. 🔄
- De changer de période selon les besoins. ⏱️
- De capturer les mouvements importants dans la tendance principale. 🚀
- D'exploiter les fluctuations plus petites pour optimiser les points d'entrée et de sortie. 🎯
🔄 Interaction entre les périodes
Période de 4 heures avec canal de régression
- Fournit une vision de la tendance dominante. 💪
- Offre une base solide pour évaluer la direction générale du marché.
- Dans ce contexte, les niveaux de Fibonacci peuvent être désactivés pour éviter l'encombrement.
- L'accent reste sur le canal de régression montrant la tendance prévalente.
Périodes inférieures avec régression et Fibonacci
- Activez les lignes de régression et les niveaux de Fibonacci sur des périodes plus courtes (5m, 15m ou 30m).
- Obtenez des signaux plus précis dans le contexte de la tendance plus large.
- Les niveaux de Fibonacci aident à identifier les points d'entrée et de sortie potentiels dans la période plus large.
📊 Comment interpréter les résultats
Identification des tendances
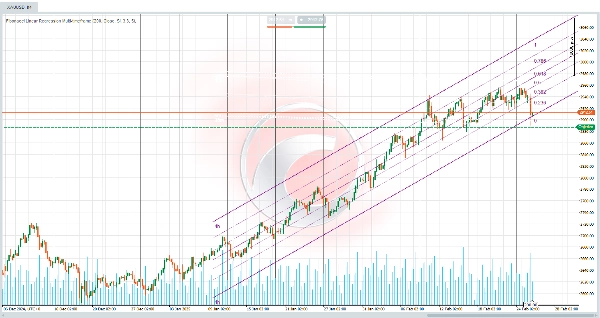
- La direction de la ligne centrale de régression indique la tendance dominante (haussière, baissière ou latérale). 📈📉➡️
- La pente de la ligne suggère la force de la tendance — des pentes plus raides indiquent des tendances plus fortes. 🔍
- La convergence des lignes de régression de différentes périodes dans la même direction signifie une tendance forte et fiable.
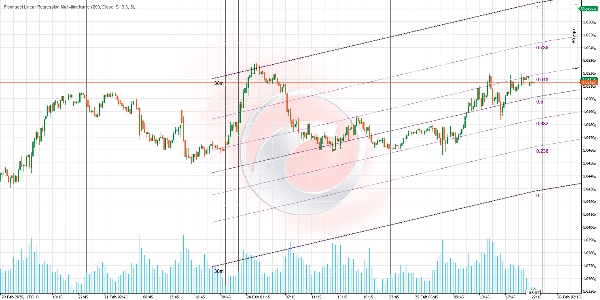
Zones de support et de résistance
- Les bandes supérieures et inférieures agissent comme des zones dynamiques de support et de résistance. 🛡️
- Les niveaux de Fibonacci à l'intérieur du canal fournissent un support/résistance supplémentaire, notamment aux niveaux 0.618 et 0.382.
- Lorsque les niveaux de Fibonacci de différentes périodes s'alignent, ils créent des zones de confluence à haute probabilité.
🌐 Identification des zones de confluence
Les zones de confluence se produisent là où les lignes de régression et les niveaux de Fibonacci se chevauchent. Ces zones représentent des points probables de réaction significative des prix :
- Lorsqu'un retracement de Fibonacci s'aligne avec le bord supérieur ou inférieur d'un canal de régression, il agit comme un point fort de support ou de résistance.
- Lorsque les lignes de régression de différentes périodes se croisent ou convergent.
- Lorsque les niveaux de Fibonacci de plusieurs périodes coïncident dans une zone spécifique.
- Lorsque le prix rebondit précisément à un niveau de Fibonacci qui coïncide avec une ligne de canal de régression.
🔄 Identification des zones de retournement
Si le prix casse le canal de régression sur une période plus courte et approche un niveau clé de Fibonacci, cela peut signaler un retournement possible. D'autres signes de retournement incluent :
- Sur-extension : lorsque le prix atteint ou dépasse la bande supérieure/inférieure, surtout lorsqu'elle est alignée avec des niveaux de Fibonacci sur plusieurs périodes.
- Divergence avec des indicateurs de momentum : utiliser cet indicateur avec le RSI, MACD ou d'autres peut améliorer la détection des divergences.
- Rupture de la ligne centrale : franchir la ligne centrale de régression peut signaler un changement dans la dynamique des prix, surtout si cela se produit simultanément sur plusieurs périodes.
🧩 Multiplicité des scénarios
L'utilisation de diverses combinaisons de canaux de régression et de niveaux de Fibonacci sur plusieurs périodes peut créer des scénarios de trading variés :
- Maintenir une position longue sur la période de 4 heures tout en tradant simultanément sur des périodes plus courtes pour profiter des rebonds Fibonacci.
- Identifier la tendance principale à l'aide du canal de régression de 4 heures et trouver des entrées optimales lors des retracements vers les niveaux de Fibonacci sur des périodes plus courtes.
- Utiliser les confluences entre plusieurs périodes pour confirmer des points d'entrée et de sortie à haute probabilité.
📈 Stratégies de trading
Stratégie de retournement
- Identifier les zones où plusieurs niveaux de Fibonacci et bandes de différentes périodes convergent.
- Attendre la confirmation du prix (figures de chandeliers, divergences, etc.).
- Entrer contre la tendance précédente avec un stop loss serré.
- Fixer des objectifs au niveau Fibonacci suivant ou à la ligne centrale de régression.
Stratégie de continuation
- Rechercher des retracements vers la ligne centrale ou les niveaux clés de Fibonacci (0.382 ou 0.618).
- Confirmer que la tendance globale reste intacte sur plusieurs périodes.
- Entrer dans la direction de la tendance lorsque le prix rebondit sur ces niveaux.
- Placer les stops loss en dessous/au-dessus du niveau Fibonacci pertinent.
En exploitant l'indicateur de Régression Linéaire de Fibonacci, les traders peuvent obtenir une compréhension plus approfondie de la dynamique du marché et prendre des décisions de trading plus éclairées. Restez vigilants et tradez intelligemment ! 💻📈
Indicateurs du Ctrader Store :
Dynamic Market Structure
Analysis of Turning Points
Fibonacci Linear
Regression Multi-timeframe
Multi-Level Candle Bias
Tracker
Auto Support and
Resistance Trend Lines
Résumé
This indicator performs simultaneous analysis across multiple timeframes—5-minute, 15-minute, 30-minute, and 4-hour—each displayed in distinct colors to identify confluence zones where signals from different timeframes align. The 4-hour timeframe focuses on the dominant trend using regression channels, while shorter timeframes include Fibonacci levels for precise entry and exit signals.
Traders can interpret the slope and direction of regression lines to assess trend strength and direction. Upper and lower bands act as dynamic support and resistance, with Fibonacci levels providing additional key zones. Confluence of regression lines and Fibonacci levels across timeframes highlights high-probability reaction points. The indicator supports reversal and continuation strategies by identifying key zones and confirming price action with multi-timeframe context.
Avis clients
5 | 100 % | |
4 | 0 % | |
3 | 0 % | |
2 | 0 % | |
1 | 0 % |