
Description
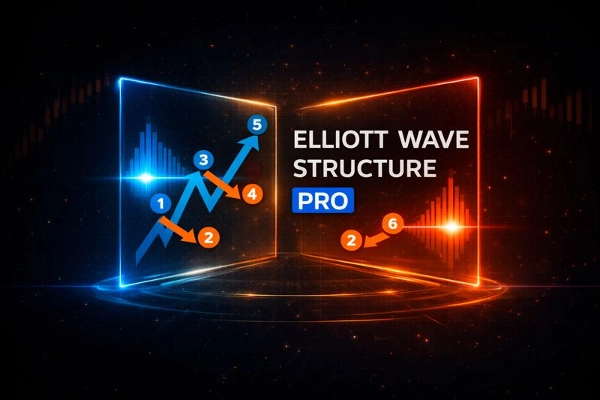
Continuation de la vague 3 d'Elliott & Renversements d'Elliott
Structure de la vague d'Elliott est un indicateur conçu pour analyser la structure du marché avec la théorie des vagues d'Elliott.
Il combine l'analyse confirmée des oscillations, la structure du marché, la détection des impulsions d'Elliott, et une continuation dédiée de la Vague 2 à la Vague 3.
Cet outil a été conçu pour les traders qui exigent clarté, confirmation et exécution basée sur des règles, et non un dessin subjectif.
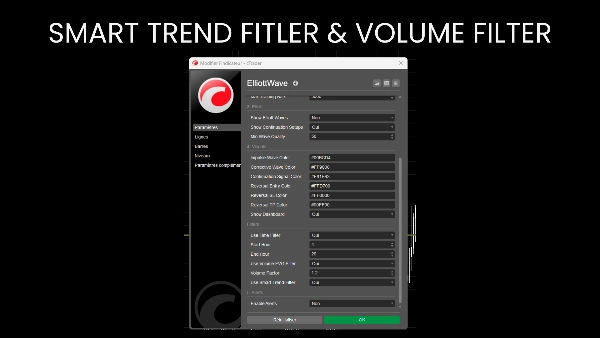
Moteur d'oscillation non repeint
Tous les calculs sont basés sur des points d'oscillation confirmés en utilisant :
- Profondeur d'oscillation ajustable
- Déviation minimale du prix (filtre de pips)
- Barres de confirmation
Une fois qu'une oscillation est affichée, elle ne bouge jamais, garantissant une fiabilité historique complète.
Analyse de la structure du marché :
Identifie et étiquette automatiquement :
- Plus haut plus haut (HH)
- Plus bas plus haut (HL)
- Plus haut plus bas (LH)
- Plus bas plus bas (LL)
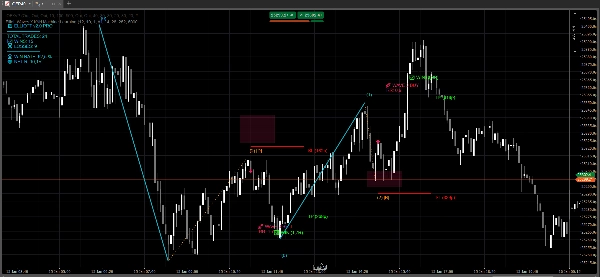
Détection des impulsions de la vague d'Elliott :
L'indicateur détecte automatiquement les impulsions complètes à 5 vagues d'Elliott dans les deux directions :
- Haussier : L-H-L-H-L-H
- Baissier : H-L-H-L-H-L
Il valide les impulsions en utilisant des règles internes :
- Force de la vague 3
- Logique de retracement des vagues 2 et 4
- Proportionnalité de la vague 5
Chaque impulsion est notée avec un score de qualité (0–100) et étiquetée directement sur le graphique.
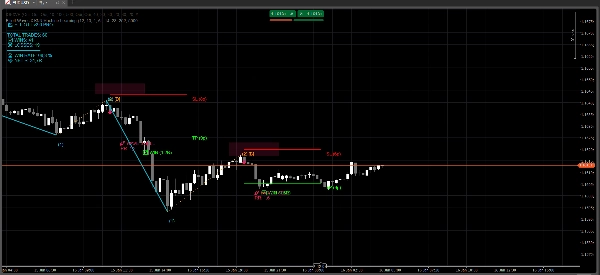
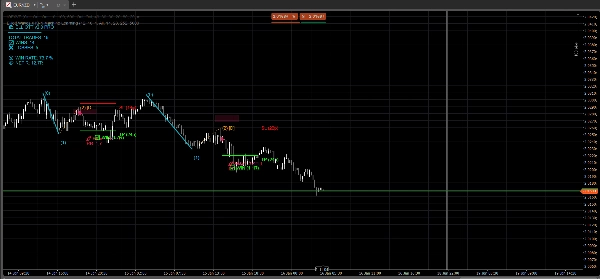
Configuration de continuation de la vague 3 (module de trading principal)
C'est le composant principal de trading de l'indicateur.
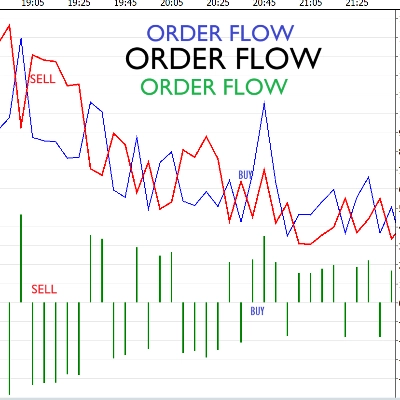
Le système identifie les structures de continuation Vague 0-1-2 et prépare les entrées pour la Vague 3 :
- Haussier : Bas → Haut → Plus bas plus haut
- Baissier : Haut → Bas → Plus haut plus bas
Les critères de validation incluent :
- Retracement de la vague 2 entre 23,6 % et 88,6 %
- Pas d'invalidation par la Vague 0
- Alignement de la tendance via la structure du marché
- Force de la Vague 1 relative à l'ATR
- Le prix doit se situer sur OB
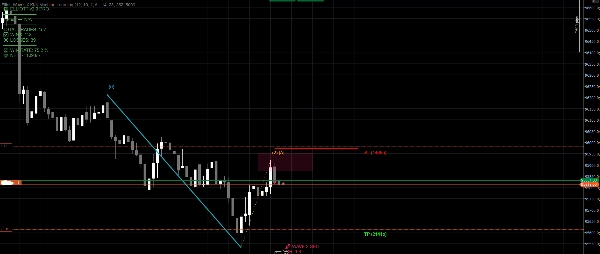
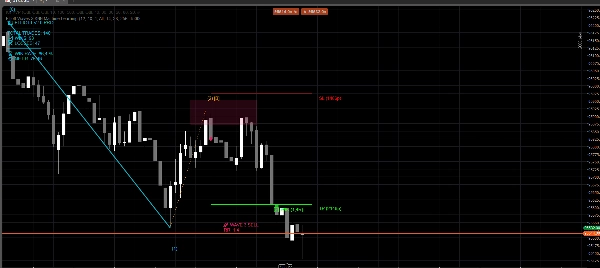
Une fois validé, l'indicateur trace automatiquement :
- Structure des vagues 1 et 2
- Zone d'entrée OB
- Signal d'entrée
- Stop Loss basé sur l'ATR au-delà de la Vague 2
- Take Profit basé sur la projection ATR
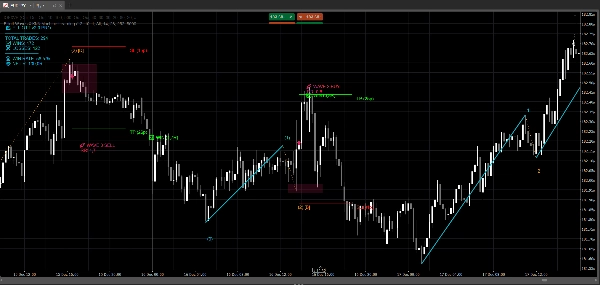
Gestion du risque et des trades
- Stop Loss et Take Profit sont calculés dynamiquement en utilisant l'ATR
- Le ratio risque-rendement est affiché directement sur le graphique
- Conçu pour éviter les configurations trop étendues ou de faible qualité
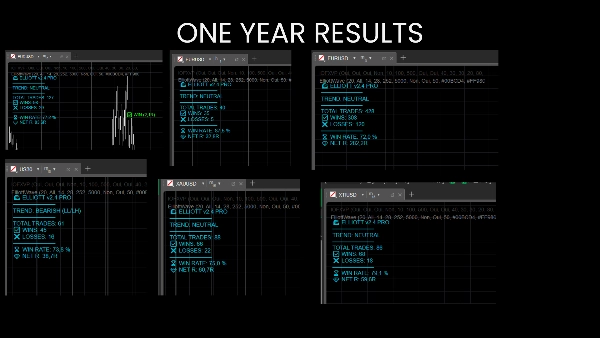
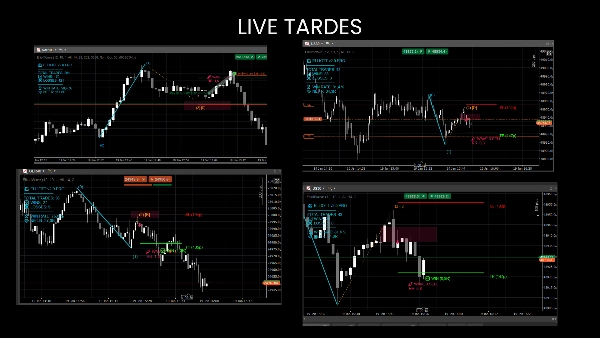
Je l'utilise personnellement pour le scalping des indices en M1 & M5, mais il fonctionne aussi avec le FX, les matières premières, les actions, etc... Le tableau de bord indique s'il a été rentable sur un actif particulier.
La version gratuite vous permet d'essayer sur les principaux FX en M15.

![Logo de "[Stellar Strategies] MARSI Signal Plotter"](https://cdn.ctrader.com/image/webp/7b2b8da6-8f8e-4646-8d4a-4710c516c01e_25567)


