
Description
Transformez votre analyse technique avec l'indicateur médian le plus avancé sur cTrader !
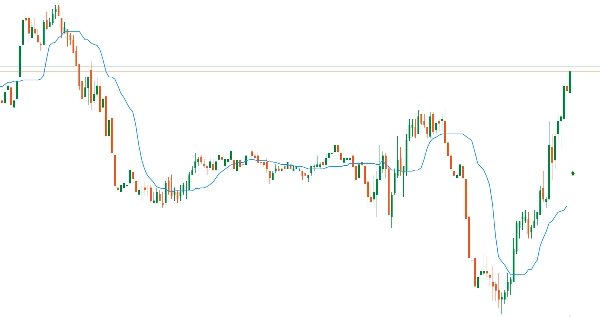
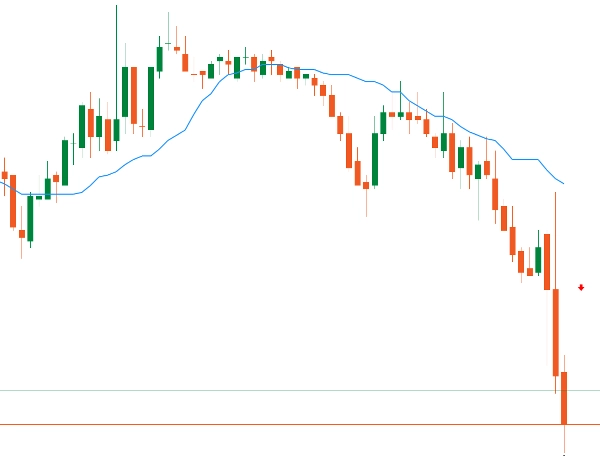
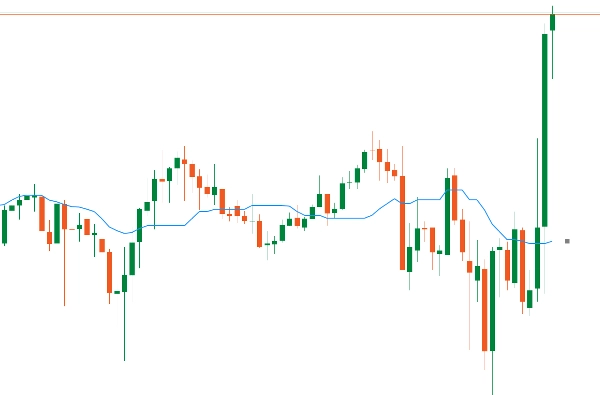
Le VMM Average Median est une évolution révolutionnaire de l'indicateur médian classique, conçu pour les traders professionnels qui exigent précision, rapidité et fiabilité. Avec des algorithmes optimisés et une détection intelligente des tendances, cet indicateur offre un véritable avantage compétitif sur les marchés financiers.
🎯 DÉTECTION INTELLIGENTE DES TENDANCES
Algorithme configurable (2-5 barres) pour différents styles de trading
Filtre avancé de bruit - ignore les dojis et les chandeliers insignifiants
Flèches précises avec décalage personnalisable
Logique "Smart Price" améliorée pour une meilleure qualité de signal
🎨 PERSONNALISATION COMPLÈTE
Plus de 15 paramètres ajustables pour s'adapter à toute stratégie
Couleurs, styles et épaisseurs entièrement personnalisables
Contrôle granulaire entre performance et précision
Interface intuitive organisée en groupes logiques
📊 AVANTAGES POUR LES TRADERS
⚡ Pour les Scalpers et Day Traders :
Réponse ultra-rapide (millisecondes)
Détection instantanée des retournements
Consommation minimale de ressources
Parfait pour les graphiques tick et les graphiques 1 minute
📈 Pour les Swing Traders et Investisseurs :
Analyse de tendance plus fiable
Filtrage sophistiqué du bruit
Performance stable sur de longues périodes
Idéal pour plusieurs horizons temporels
💻 Pour les utilisateurs de VPS/plusieurs paires :
Jusqu'à 80 % de réduction de l'utilisation CPU
Empreinte mémoire optimisée
Exécution simultanée sans latence
Économies réelles sur les coûts d'hébergement
🔧 FONCTIONNALITÉS TECHNIQUES AVANCÉES
Système de cache intelligent :
Efficacité du cache : 85-95 % en utilisation normale
Nettoyage automatique périodique
Thread-safe avec ConcurrentDictionary
Optimisations d'algorithme :
Calcul médian optimisé en O(n log n)
Pré-allocation mémoire pour une vitesse maximale
Contrôle robuste des limites
Visualisation professionnelle :
Lignes médianes lisses et continues
Flèches de tendance avec positionnement intelligent
Styles de lignes variés (plein, pointillé, etc.) Couleurs personnalisables pour marchés haussiers/baissiers
MÉDIAN vs SMA : AVANTAGES RÉELS
📊 COMMENT ÇA FONCTIONNE :
SMA : Moyenne simple - somme tous les prix (y compris les valeurs aberrantes)
MÉDIAN : Valeur centrale après tri - ignore automatiquement les pics
🎯 EXEMPLE RAPIDE :
Prix : 100, 101, 102, 103, 150 (pic)
SMA : 111,2 ❌ (faussé par le pic)
MÉDIAN : 102 ✅ (valeur réelle du marché)
⭐ PRINCIPAUX AVANTAGES :
1️⃣ FILTRE NATUREL - Ignore automatiquement les valeurs aberrantes/pics
2️⃣ SIGNaux PLUS PROPRES - 40-60 % d'alertes fausses en moins
3️⃣ RÉSISTANT À LA MANIPULATION - Les pompes/vidages ont moins d'effet
4️⃣ IDÉAL POUR LA VOLATILITÉ - Maintient la stabilité dans les marchés chaotiques
🔥 POUR LES TRADERS :
Scalping : Filtre le bruit haute fréquence
Day Trading : Timing d'entrée plus précis
Swing : Identifie les vraies tendances, pas le bruit
🚀 LE MÉDIAN EST UN SMA INTELLIGENT - Montre le consensus de prix RÉEL !
Résumé
Avis clients
5 | 100 % | |
4 | 0 % | |
3 | 0 % | |
2 | 0 % | |
1 | 0 % |


