
Description
Le Problème
Les moyennes mobiles standard ont un retard. Au moment où elles signalent un changement de tendance, la moitié du mouvement est déjà terminée. Vous avez besoin de quelque chose de plus rapide—quelque chose qui capte les retournements au moment où ils se produisent, pas quelques barres plus tard.
La Solution
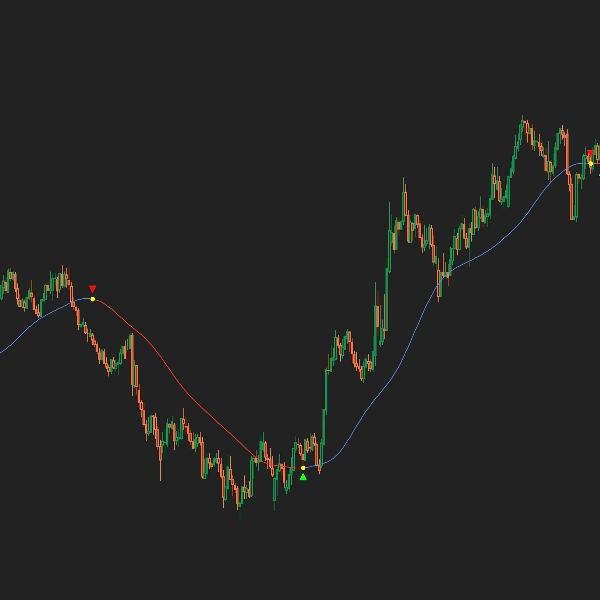
Coral utilise un filtre IIR sophistiqué à 6 étapes (Infinite Impulse Response) pour fournir des signaux de tendance ultra-lisses avec un retard minimal. La ligne codée par couleur vous montre exactement quand les tendances changent : bleu pour les tendances haussières, rouge pour les tendances baissières, et des points jaunes signalent le moment exact du retournement.
Caractéristiques Clés
- Filtre IIR à 6 Étapes : Algorithme de lissage avancé basé sur six étapes EMA consécutives pour des signaux plus propres
- Tendances Codées par Couleur : Ligne bleue pour les tendances ascendantes, ligne rouge pour les tendances descendantes—clarté visuelle en un coup d'œil
- Points de Signal Jaunes : Les points jaunes marquent le moment exact où la direction de la tendance s'inverse
- Notifications d'Alerte : Recevez des alertes popup et sonores lors des retournements de tendance
- Flèches d'Entrée : Des symboles de flèche optionnels marquent les points d'entrée haussiers (▲) et baissiers (▼)
Comment Ça Marche
Coral applique un filtre de lissage exponentiel à 6 étapes aux données de prix, puis calcule la pente pour détecter la direction de la tendance. Lorsque la pente passe de négative à positive, un retournement haussier est signalé. Lorsque la pente passe de positive à négative, un retournement baissier est signalé. Le rendu discontinu de la ligne crée une visualisation propre et segmentée de la tendance.
Stratégie d'Entrée
- Entrée Longue : Rouge → Jaune → Bleu (entrer lorsque la ligne bleue apparaît après le signal jaune)
- Entrée Courte : Bleu → Jaune → Rouge (entrer lorsque la ligne rouge apparaît après le signal jaune)
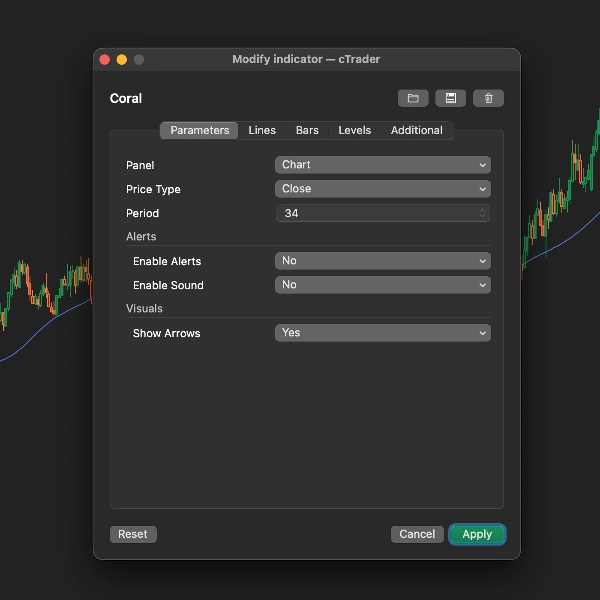
Paramètres
- Type de Prix : Source de prix pour le calcul (par défaut : Clôture)
- Période : Période de lissage (par défaut : 34) — des valeurs plus élevées = plus de lissage
- Activer les Alertes : Notifications popup lors des retournements
- Activer le Son : Alertes sonores pour les changements de signal
- Afficher les Flèches : Afficher les symboles de flèche aux points de retournement
Exigences
- Période : Toutes les périodes sont supportées
- Symboles : Forex, Indices, Métaux, Actions
- Type de Compte : N'importe lequel
Avertissement sur les Risques
Le trading comporte des risques. Les performances passées ne garantissent pas les résultats futurs. Cet indicateur fournit uniquement des signaux—la gestion appropriée des risques est de votre responsabilité.
Résumé
Avis clients
5 | 0 % | |
4 | 100 % | |
3 | 0 % | |
2 | 0 % | |
1 | 0 % |


![Logo de "Gaussian Channel [Iridio Capital]"](https://cdn.ctrader.com/image/webp/7c039209-5573-4a54-a072-f9528b503103_41960)