Deskripsi
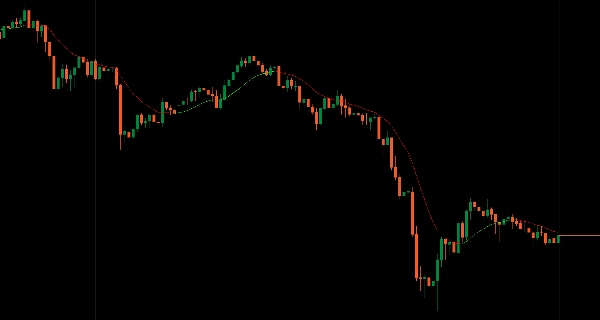
Analisis tren adaptif menggunakan matematika regresi berbobot kernel.
Menerapkan pembobotan kernel Gaussian di mana batang yang dekat memberikan pengaruh lebih besar dan batang yang jauh memudar secara eksponensial, menciptakan garis tren yang sangat halus tanpa lag periode tetap.
Penyesuaian otomatis terhadap struktur harga lokal, lag minimal dibandingkan dengan rata-rata bergerak tradisional, pengkodean warna dinamis (Lime tren naik, Merah tren turun), bandwidth yang dapat disesuaikan untuk penyetelan responsivitas, jendela lookback fleksibel (50-2000 batang), dan desain bebas kebisingan dua warna memberikan identifikasi tren yang tepat secara matematis bagi para trader yang mencari perataan adaptif tanpa pemilihan periode sewenang-wenang.
FITUR
Perhitungan Berbobot Kernel
- Batang yang dekat memberikan pengaruh lebih besar, batang yang jauh memudar secara eksponensial—tanpa periode tetap sewenang-wenang
- Pembobotan kernel Gaussian untuk perataan yang optimal secara matematis
- Secara otomatis menyesuaikan dengan struktur harga lokal tanpa kalibrasi manual
- Lag minimal: Merespons perubahan tren nyata lebih cepat dibandingkan rata-rata bergerak setara
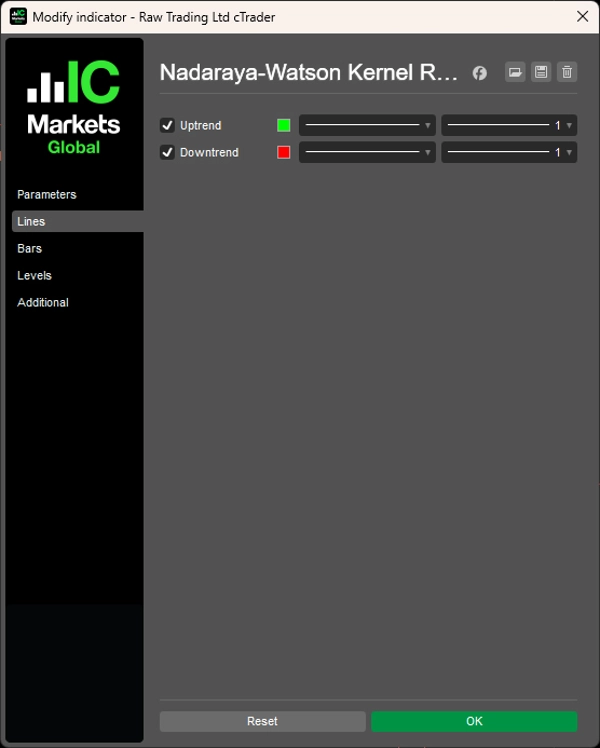
Pengkodean Warna Dinamis
- Lime: Tren naik
- Merah: Tren turun
- Konfirmasi visual instan arah tren
- Tampilan garis diskontinu: Perubahan warna instan dan jelas secara visual
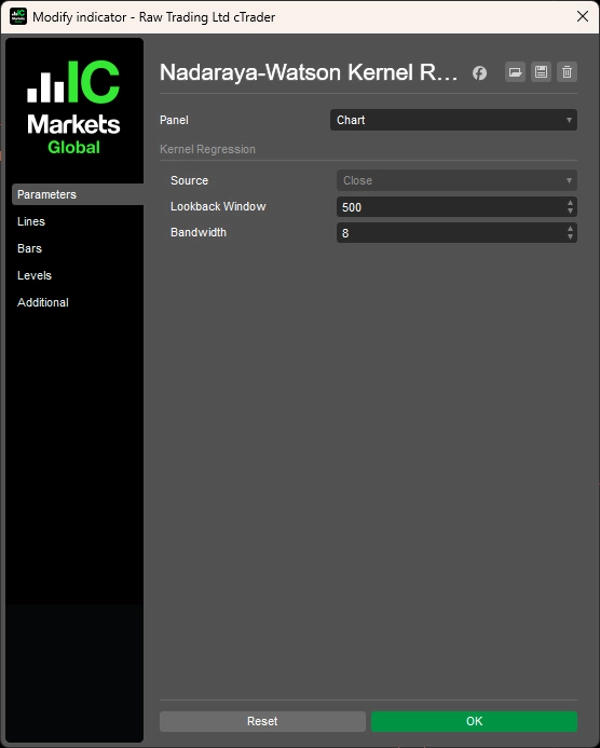
Parameter yang Dapat Disesuaikan
- Bandwidth: Menyetel responsivitas vs. kehalusan
- Jendela lookback fleksibel: 50-2000 batang sesuai dengan kerangka waktu Anda
- Beradaptasi dengan kondisi pasar dan gaya trading yang berbeda
Desain Bersih
- Dua warna, tanpa kekacauan—baik tren naik atau tren turun
- Identifikasi tren bebas kebisingan
- Tidak memerlukan pengaturan kompleks
- Kesederhanaan visual dengan presisi matematis
__________________________________________________________________________________________
INDIKATOR GRATIS LAINNYA
Jelajahi berbagai alat analisis pasar—dari struktur dan volume hingga regresi, volatilitas, dan kerangka waktu kustom.
Kode sumber tersedia di repository GitHub.
Semua gratis untuk digunakan. Namun jika Anda ingin memberikan dukungan kopi, Anda dapat mengarahkannya di sini.
Support/Resistance
Volume
- Volume Activity Profiler
- Volume Efficiency Analyzer
- Volume Profile Analytics
- Volume Profile - Updated
- Volume Spread Analysis
- VWAP (Volume Weighted Average Price)
Moving Averages
- SSL Channel
- Anchored Moving Average
- Deviation-Scaled Moving Average
- Gann High Low Activator
- Instantaneous Trendline
- Kaufman Adaptive MA with Trend Vision
- Moving Average Channel
- Moving Averages Suite
- Trend Channel Moving Average
Utilities/Custom
Berbasis Regresi
Volatilitas
Osilator
__________________________________________________________________________________________
PENOLAKAN
Perdagangan melibatkan risiko. Indikator ini dimaksudkan hanya untuk analisis teknis — selalu terapkan manajemen risiko yang tepat dan berdagang dengan bertanggung jawab.
MASUKAN & PENINGKATAN
Jika Anda memiliki saran, permintaan fitur, atau ide untuk peningkatan, silakan tinggalkan komentar di tab Diskusi. Masukan Anda membantu meningkatkan indikator untuk semua orang.
Ringkasan
Key features include dynamic color coding with lime indicating uptrends and red indicating downtrends, offering instant visual confirmation of trend direction through a noise-free, two-color design. Users can fine-tune the indicator’s responsiveness and smoothness via adjustable bandwidth and select a flexible lookback window ranging from 50 to 2000 bars to suit various timeframes and market conditions.
The indicator emphasizes mathematical precision and visual simplicity, requiring no complex settings. It is designed for traders seeking an adaptive smoothing method for trend identification without arbitrary period selection. This tool supports scalping strategies and is part of a broader suite of market analysis indicators focused on regression, volume, volatility, and custom timeframes.
Ulasan pelanggan
5 | 100 % | |
4 | 0 % | |
3 | 0 % | |
2 | 0 % | |
1 | 0 % |