
VegaXLR - Market Sessions Alerts
อินดิเคเตอร์
3 การซื้อ
เวอร์ชัน 1.0, Feb 2025
Windows, Mac
4.0
รีวิว: 1
คำอธิบาย
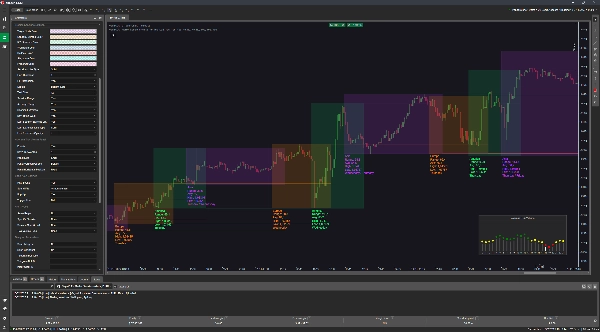
ตัวบ่งชี้แจ้งเตือนเซสชันตลาด cTrader ช่วยผู้ค้าโดยการทำเครื่องหมายเซสชันตลาดและรวมเข้ากับกลุ่มภูมิภาค: เอเชีย อเมริกา และยุโรป มันขยายจุดสูงสุดและต่ำสุดของเซสชันเพื่อเน้นระดับแนวรับและแนวต้านที่สำคัญ และส่งการแจ้งเตือนผ่าน Telegram, อีเมล หรือป๊อปอัป cTrader เมื่อราคาถึงระดับเหล่านี้ นอกจากนี้ยังมีแผงแสดงปริมาณทิกเฉลี่ยสำหรับแต่ละชั่วโมง ช่วยในการระบุเวลาการเทรดที่เหมาะสม
คุณสมบัติ:
- ไฮไลท์เซสชันตลาด:
-
- ทำเครื่องหมายเซสชันแต่ละเซสชัน: โตเกียว, ลอนดอน, นิวยอร์ก/อเมริกา, เวลลิงตัน, ซิดนีย์, สิงคโปร์, แฟรงก์เฟิร์ต
- รวมเซสชันเข้ากับกลุ่มภูมิภาค: เอเชีย, ยุโรป, อเมริกา
- ระดับแนวรับและแนวต้าน:
-
- ขยายจุดสูงสุดและต่ำสุดของเซสชันเพื่อระบุระดับแนวรับและแนวต้านที่สำคัญ
- การแจ้งเตือนที่ปรับแต่งได้:
-
- แจ้งเตือนผ่าน Telegram, อีเมล, ป๊อปอัป cTrader และเสียง
- ประเภทการแจ้งเตือนประกอบด้วย:
-
- ภูมิภาคเดียวกัน: แจ้งเตือนเมื่อราคาของเซสชันปัจจุบันแตะระดับสูงสุดหรือต่ำสุดของเซสชันก่อนหน้าในภูมิภาคเดียวกัน
- เซสชันเฉพาะ: แจ้งเตือนเมื่อราคาสัมผัสระดับสูงสุดหรือต่ำสุดของเซสชันที่เลือกในอดีต
- เริ่มต้นและสิ้นสุดเซสชัน: แจ้งเตือนเมื่อเริ่มต้นและสิ้นสุดเซสชัน
- ประเภทปริมาณทิก: แจ้งเตือนเมื่อปริมาณทิกเฉลี่ยถึงระดับที่กำหนด
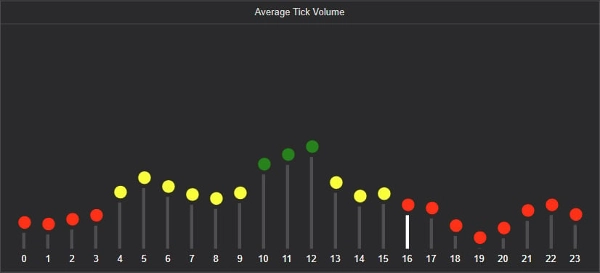
- แผงปริมาณทิกเฉลี่ย:
-
- แสดงปริมาณทิกเฉลี่ยสำหรับแต่ละชั่วโมงในช่วงจำนวนวันที่กำหนดได้
- ใช้การระบายสีเพื่อแสดงระดับปริมาณ: แดง (ต่ำ), เหลือง (ปานกลาง), เขียว (สูง)
- คู่มือผู้ใช้: คุณสามารถเข้าถึงคู่มือผู้ใช้ของตัวบ่งชี้นี้ได้โดยคลิกที่ปุ่มเล็ก ๆ บนแผนภูมิ
ตัวบ่งชี้นี้ถูกออกแบบมาเพื่อเพิ่มประสิทธิภาพกลยุทธ์การเทรดโดยให้สัญญาณภาพที่ชัดเจนและการแจ้งเตือนที่ทันเวลาโดยอิงจากพลวัตของเซสชันตลาด
สรุป
โปรไฟล์อินดิเคเตอร์
รีวิวจากลูกค้า
4.0
รีวิว: 1
5 | 0 % | |
4 | 100 % | |
3 | 0 % | |
2 | 0 % | |
1 | 0 % |
รีวิวจากลูกค้า
การสนทนา
คำถามที่พบบ่อย
Forex
ผลิตภัณฑ์ที่มีให้บริการผ่าน cTrader Store รวมถึงบอทการเทรด อินดิเคเตอร์ และปลั๊กอิน มีให้บริการโดยนักพัฒนาบุคคลที่สามและมีไว้เพื่อวัตถุประสงค์ในการเข้าถึงข้อมูลและทางเทคนิคเท่านั้น cTrader Store ไม่ใช่โบรกเกอร์และไม่ได้ให้คำแนะนำการลงทุน คำแนะนำส่วนบุคคล หรือการรับประกันผลการดำเนินงานในอนาคต


ราคา
230
การขาย
686
ติดตั้งฟรี