
Deskripsi
Indikator FZ untuk cTrader
Deskripsi
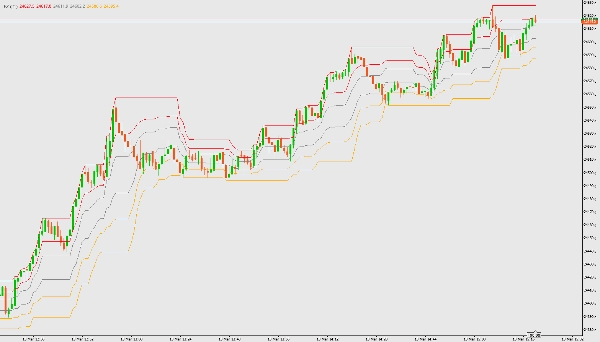
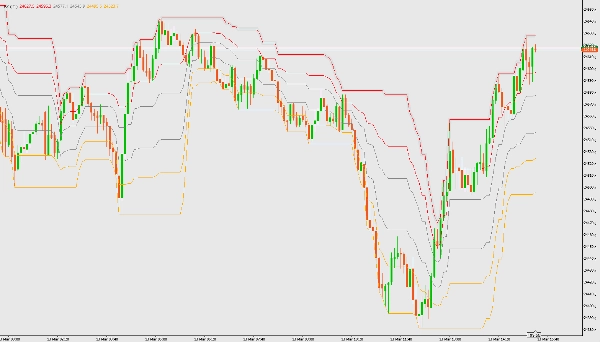
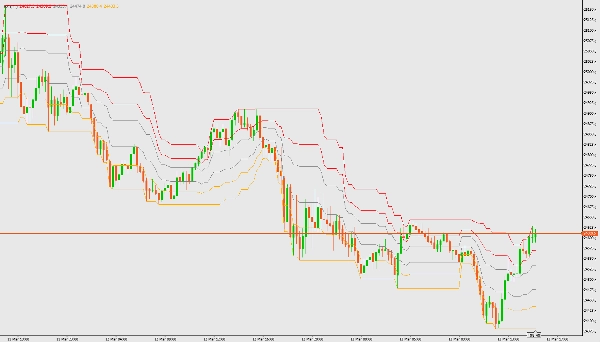
Indikator FZ menggambar zona saluran Fibonacci berdasarkan harga tertinggi dan terendah selama periode yang ditentukan pengguna. Ini membantu mengidentifikasi zona tren dan area pembalikan potensial.
Fitur
- Menghitung batas saluran dan level Fibonacci (0.236, 0.382, 0.618, 0.786)
- Memvisualisasikan zona uptrend, ranging, dan downtrend
- Tumpang tindih pada grafik harga
Parameter
- hitung untuk ## bar terakhir: Jumlah bar yang digunakan untuk perhitungan (default: 21)
Cara Menggunakan
- Unduh dan tambahkan file indikator FZ (FZ.cs) ke platform cTrader Anda.
- Kompilasi indikator di cTrader Automate.
- Pasang indikator ke grafik mana pun.
- Sesuaikan parameter jumlah bar sesuai kebutuhan.
- Interpretasikan zona berwarna:
-
- Sian: Zona uptrend (beli)
- Abu-abu: Zona ranging (tunggu perubahan tren)
- Oranye: Zona downtrend (jual)
Ringkasan
Profil indikator
Ulasan pelanggan
4.0
Ulasan: 2
5 | 0 % | |
4 | 100 % | |
3 | 0 % | |
2 | 0 % | |
1 | 0 % |
Diskusi
Pertanyaan umum
BTCUSD
Forex
Signal
Breakout
Indices
EURUSD
Commodities
GBPUSD
NZDUSD
Prop
Scalping
Crypto
Grid
Stocks
AI
XAUUSD
NAS100
USDJPY
Produk-produk yang tersedia melalui cTrader Store, termasuk bot trading, indikator, dan plugin, disediakan oleh pengembang pihak ketiga serta hanya ditujukan untuk akses teknis dan informasi. cTrader Store bukan broker dan tidak menyediakan saran investasi, rekomendasi pribadi, atau jaminan apa pun tentang kinerja di masa mendatang.
Produk lain dari penulis ini


![Logo "High-Low Divergence [Iridio Capital]"](https://cdn.ctrader.com/image/webp/443c4661-7abb-40f1-842f-4b6ec560649b_40914)


Harga
Sejak 10/03/2026
105
Instal gratis