🚀 Lebih dari 10.000 trader sudah menggunakan indikator TOP kami 🏆 …dan komunitas terus berkembang!
Temukan mengapa para profesional memilih kami – alat paling kuat cTrader (indikator + algoritma + cBots) menunggu Anda.
👉 Dapatkan semua sistem TOP kami di sini:
Indikator Toko Pinescriptlabs: Toko Pinescriptlabs cBots : (cBot) Gold & BTC BreakoutSession Pivots(baru)
Struktur Pasar Lanjutan: Bos, Choch, SwinLevels, Order Blocks, Market Structure & Liquidity Finder (Baru)
Proyeksi Likuiditas Harga ZigZag
Algoritma Pintar Trailing (baru)
Prediksi Berdasarkan Linreg & ATR
SmartTrend Support &
Resistance
Lines
Analisis
Struktur Pasar
Dinamis
dari
Titik
Balik
Fibonacci
Regresi
Linear
Multi-timeframe
Pelacak
Bias Lilin
Multi-Level
Tracker
Garis
Tren Dukungan dan
Perlawanan
Otomatis
Lines
Semua
Tingkat Dukungan dan
Perlawanan
Levels
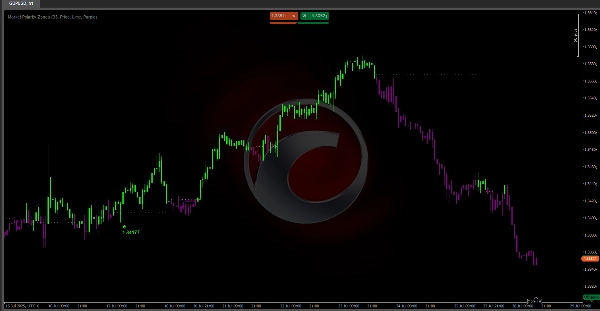
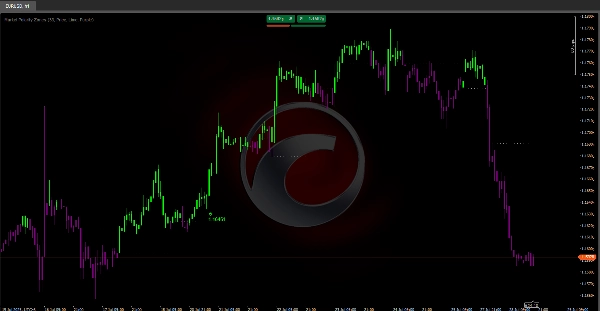
Zona Polaritas Pasar 📊
Apa yang dilakukan algoritma ini?
Zona Polaritas Pasar adalah indikator canggih yang menyederhanakan analisis pasar dengan secara otomatis mengidentifikasi fase bullish 🚀 atau bearish 🐻 dan menandai level kunci di mana pembalikan tren kemungkinan terjadi.
Ideal untuk:
- Trader aksi harga
- Trader swing
- Scalper,...yang perlu dengan cepat mengenali arah pasar dan titik masuk/keluar yang tepat.
Bagaimana logikanya bekerja?
Algoritma menggunakan dua Hull Moving Averages (HMA) dengan periode berbeda untuk mendeteksi pergeseran momentum dan menetapkan level dinamis sebagai berikut:
- Mendeteksi persilangan HMA untuk mengidentifikasi perubahan tren.
- Menetapkan level otomatis:
-
- Persilangan bullish → Menandai titik rendah sebagai level support
- Persilangan bearish → Menandai titik tinggi sebagai level resistance
- Mempertahankan level aktif sampai terjadi persilangan baru.
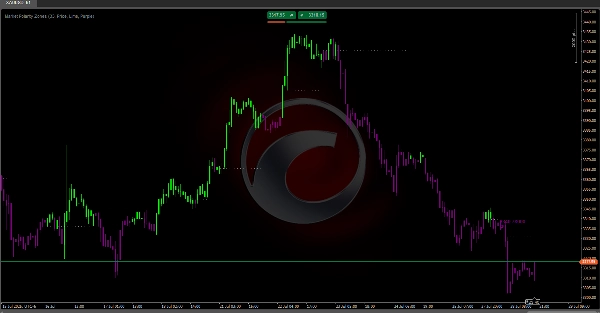
Apa yang akan Anda lihat di grafik Anda:
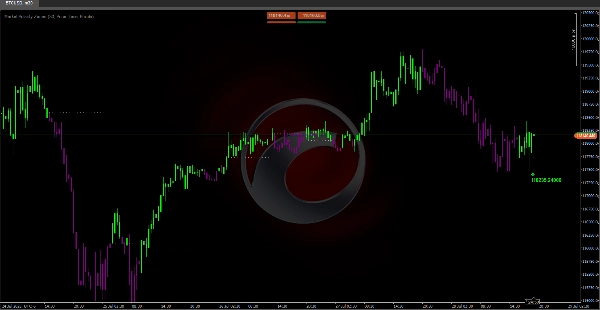
🎨 Sistem warna intuitif:
- Lilin hijau 🟢: Harga di atas level (zona bullish – cari pembelian)
- Lilin ungu 🟣: Harga di bawah level (zona bearish – cari penjualan)
📉 Garis level dinamis:
- Garis horizontal putus-putus menandai level polaritas aktif
- Memperpanjang secara otomatis selama level tetap valid
- Hanya muncul saat level stabil
⚠️ Peringatan pembalikan:
Label panah muncul saat pola tertentu terbentuk:
- 🔻 Pembalikan Bearish (label ungu):
-
- Pola: Harga naik → gagal → turun di bawah level
- Arti: Tekanan bullish melemah, kemungkinan beralih ke zona bearish
- 🔺 Pembalikan Bullish (label hijau):
-
- Pola: Harga turun → memantul → naik di atas level
- Arti: Pembeli mempertahankan level, kemungkinan beralih ke zona bullish
ℹ️ Informasi label:
- "Harga": Menunjukkan titik kegagalan breakout yang tepat – gunakan untuk stop yang tepat atau mengidentifikasi resistance/support kunci.
- "Volume": Jumlah volume 3 bar terakhir – mengonfirmasi apakah pembalikan memiliki partisipasi pasar nyata.
Pengaturan yang direkomendasikan:
- Panjang: 33 (default) – Bekerja baik untuk sebagian besar pasar
- Data Label: "Harga" untuk presisi level, "Volume" untuk konfirmasi
- Warna: Pertahankan Lime/Ungu untuk kontras visual terbaik 🎨