
STC
Indikator
278 unduhan
Versi 1.0, Jan 2025
Windows, Mac
5.0
Ulasan: 2
Deskripsi
The Schaff Trend Cycle (STC), dikembangkan oleh analis teknis terkenal Doug Schaff, adalah indikator perdagangan canggih yang dirancang untuk mengidentifikasi tren pasar dan pembalikan dengan kecepatan dan presisi luar biasa. Berakar pada ide inovatif menggabungkan komponen tren dan siklus, STC memanfaatkan rata-rata bergerak eksponensial (EMA) dan perhitungan stokastik untuk mengatasi keterbatasan indikator yang tertinggal seperti MACD atau Stochastic Oscillator. Pendekatan unik ini memberikan sinyal perdagangan yang lebih awal dan lebih dapat diandalkan, menawarkan keunggulan signifikan dalam deteksi tren dan analisis pasar.
Fitur Utama:
- Deteksi Tren Dini: Menggabungkan rata-rata bergerak eksponensial (EMA) dengan perhitungan stokastik untuk menangkap tren lebih cepat.
- Pengaturan yang Dapat Disesuaikan: Sesuaikan panjang, MA cepat, MA lambat, jenis MA, dan faktor pelurusan sesuai strategi perdagangan Anda.
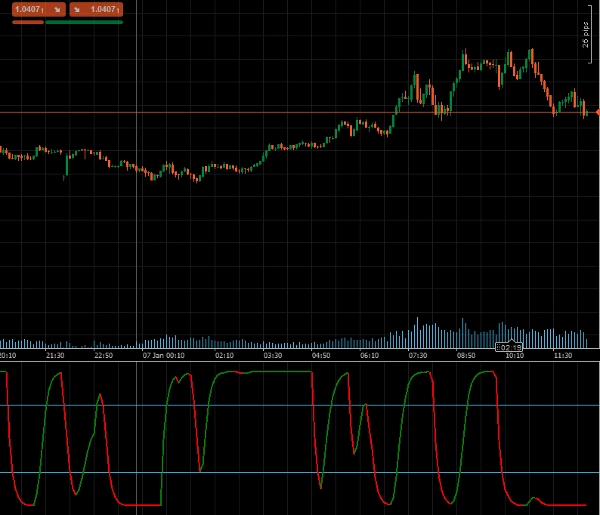
- Peringatan Visual: Perubahan warna dinamis menunjukkan tren bullish atau bearish, memudahkan interpretasi kondisi pasar.
- Dukungan untuk Level Overbought/Oversold: Level bawaan (25 dan 75) membantu mengidentifikasi potensi titik balik pasar.
Parameter
- Panjang: Menentukan jumlah periode untuk perhitungan tren.
- Panjang MA Cepat: Menetapkan panjang rata-rata bergerak cepat.
- Panjang MA Lambat: Menentukan panjang rata-rata bergerak lambat.
- Jenis MA: Memungkinkan pemilihan jenis rata-rata bergerak (misalnya, EMA, SMA).
- Faktor Pelurusan: Menyesuaikan faktor pelurusan untuk sinyal tren yang lebih halus.
Output
- STC: Menghasilkan nilai utama Schaff Trend Cycle, yang mewakili arah dan kekuatan tren, untuk penggunaan programatik dalam sistem perdagangan otomatis.
- STCBull: Menyoroti kondisi tren bullish.
- STCBear: Menyoroti kondisi tren bearish.
Ringkasan
Profil indikator
Ulasan pelanggan
5.0
Ulasan: 2
5 | 100 % | |
4 | 0 % | |
3 | 0 % | |
2 | 0 % | |
1 | 0 % |
Ulasan pelanggan
August 12, 2025
Pros: Fast and accurate trend detection, earlier signals than MACD, customizable levels. Cons: No alerts, no MTF mode, no trade statistics.
Diskusi
Pertanyaan umum
MACD
Produk-produk yang tersedia melalui cTrader Store, termasuk bot trading, indikator, dan plugin, disediakan oleh pengembang pihak ketiga serta hanya ditujukan untuk akses teknis dan informasi. cTrader Store bukan broker dan tidak menyediakan saran investasi, rekomendasi pribadi, atau jaminan apa pun tentang kinerja di masa mendatang.
Produk lain dari penulis ini


Harga
Sejak 24/09/2024
4.46K
Instal gratis