说明
Candle Pro – 蜡烛图上的视觉 RSI 信号
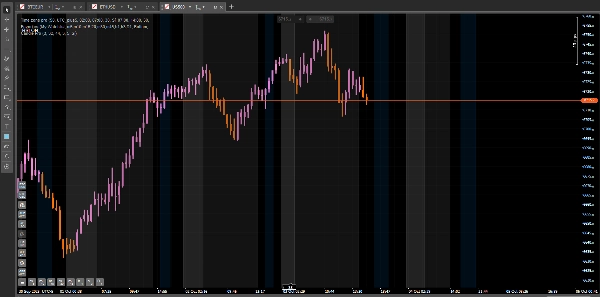
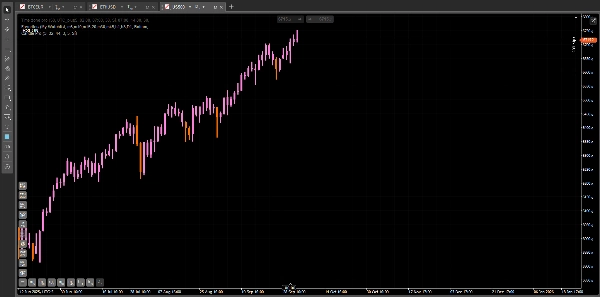
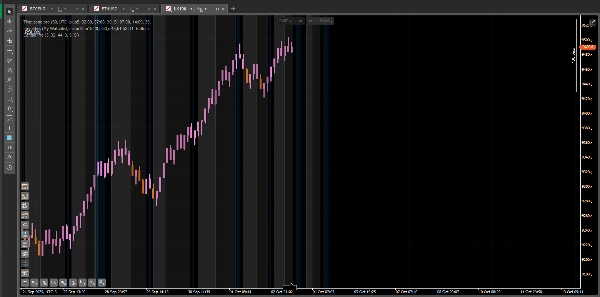
Candle Pro 是一个指标,当 RSI 达到超买或超卖水平时,会直接在图表上突出显示蜡烛,帮助您专注于价格走势,避免额外的子图表。
🧭 使用方法
- 将指标添加到您的图表中。
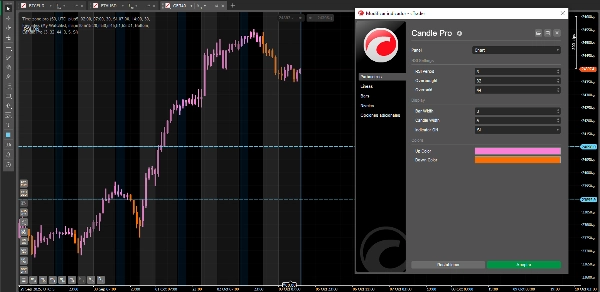
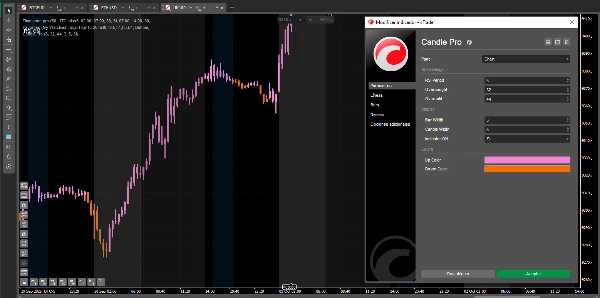
- 调整 RSI 参数以适应您的交易风格。
- 观察蜡烛在极端水平时如何变色,标记潜在的反转或动量区域。
⚙️ 建议设置
为了快速且精准的响应:
- RSI 周期: 3
- 超买: 32
- 超卖: 44
- 蜡烛宽度: 3
- 柱宽: 1
✨ 优点
- 直接在价格上显示清晰的视觉信号。
- 适用于任何符号和时间框架。
- 颜色和线宽完全可自定义。
- 非常适合 剥头皮交易、 日内交易和 波段交易。
注意: 这是 免费版本的 Candle Pro。一个 高级版本即将推出,内含独家功能,助您将交易提升到新水平。
摘要
AI 摘要
Candle Pro is a trading indicator designed to visually highlight RSI (Relative Strength Index) signals directly on price candles, eliminating the need for separate RSI sub-charts. It marks candles on the chart when RSI reaches overbought or oversold levels, helping traders identify potential reversal or momentum zones. Users can customize RSI parameters, candle colors, and line widths to suit their trading style. The indicator supports any symbol and timeframe, making it suitable for scalping, intraday, and swing trading strategies. Suggested settings include an RSI period of 3, overbought level at 32, and oversold level at 44 for fast and precise signals. Candle Pro emphasizes clean visual cues integrated with price action to maintain chart clarity. This version is the free edition, with a premium version planned to offer additional features. Supported markets include Forex, Indices, and Crypto.
指标配置
客户评价
5.0
评价:1
5 | 100 % | |
4 | 0 % | |
3 | 0 % | |
2 | 0 % | |
1 | 0 % |
客户评价
November 3, 2025
This is an interesting indicator it really helps to filter out market noise. Thanks
讨论
常见问答
Forex
Indices
RSI
Crypto
cTrader Store 提供的所有产品,包括交易机器人、指标和插件,均由第三方开发者提供,仅供信息参考和技术访问之用。cTrader Store 并非经纪商,不提供投资建议、个人推荐或任何未来业绩保证。


猜您喜欢


价格
注册日期 24/02/2025
15
销售
1.84K
免费安装